
Überblick
Die Strategie nutzt mehrere Moving Averages (VWMA), Average Directional Indices (ADX) und Moving Indicators (DMI), um mehrere Gelegenheiten im Bitcoin-Markt zu erfassen. Durch die Kombination mehrerer technischer Indikatoren wie Preisbewegung, Trendrichtung und Handelsvolumen, zielt die Strategie darauf ab, Eintrittspunkte zu finden, an denen ein starker, dynamischer Aufwärtstrend besteht, während das Risiko streng kontrolliert wird.
Strategieprinzip
- Die VWMA am 9. und am 14. Tag wird verwendet, um den Mehrkopftrend zu beurteilen, der ein Mehrkopfsignal erzeugt, wenn die kurzfristige Durchschnittslinie die langfristige Durchschnittslinie durchbricht.
- Die Einführung einer Adaptive Meanline, die aus einem 89-Tage-Höchst- und Tiefstpreis-VWMA aufgebaut ist, als Trendfilter, der nur dann berücksichtigt wird, wenn der Schlusskurs oder der Eröffnungskurs über dieser Meanline liegt.
- Der Trend wird nur dann als stark genug angesehen, wenn der ADX größer als 18 ist und die Differenz zwischen +DI und -DI größer als 15 ist.
- Filtern Sie mit der Perzentsatzfunktion der Transaktionsmenge eine Balkenlinie, in der die Transaktionsmenge zwischen 60% und 95% liegt, und vermeiden Sie Zeiten mit zu niedrigem Transaktionsvolumen.
- Die Stop-Loss-Einstellungen liegen zwischen 0,96 und 0,99 mal höher als die Höhe der vorherigen K-Linie und sinken mit zunehmendem Zeitrahmen, um das Risiko zu kontrollieren.
- Platzierung bei Erreichen der vorgegebenen Haltedauer oder bei einem Preisrückgang unterhalb der Selbstanpassungsmittellinie.
Analyse der Stärken
- In Kombination mit mehreren technischen Indikatoren, die die Marktlage in mehreren Dimensionen wie Trends, Dynamik und Handelsvolumen beurteilen, sind die Signale zuverlässiger.
- Die automatische Durchschnittslinie und die Filtermechanismen für die Transaktionsmenge filtern die falschen Signale effektiv ab und reduzieren die Anzahl der ungültigen Transaktionen.
- Strenge Stop-Loss-Einstellungen und eine begrenzte Laufzeit der Positionen reduzieren die Risikobereitschaft der Strategie.
- Der Code ist modular gestaltet, gut lesbar und wartbar, so dass er weiter optimiert und erweitert werden kann.
Risikoanalyse
- Diese Strategie kann mehr falsche Signale erzeugen, wenn der Markt in Schwankungen oder unklaren Trends steckt.
- Die Stop-Loss-Position ist relativ nahe und kann bei starken Schwankungen des Marktes zu früh ausgelöst werden, was zu einer Vergrößerung der Verluste führt.
- Die fehlende Berücksichtigung der makroökonomischen Situation und der bedeutenden Ereignisse könnte im Angesicht der "Schwarzen Schwämmen" fehlgeschlagen sein.
- Die Parameter sind relativ fest eingestellt, es fehlt an Anpassungsfähigkeit und die Performance kann in verschiedenen Marktumgebungen instabil sein.
Optimierungsrichtung
- Die Einführung von mehr Indikatoren, die die Marktumgebung abbilden können, wie der Relative Strength Index (RSI) und die Brin-Band, verbessert die Zuverlässigkeit der Signale.
- Dynamische Optimierung von Stop-Loss-Positionen, z. B. durch Verwendung von ATR oder Stop-Percentage, um auf unterschiedliche Marktschwankungen zu reagieren.
- In Verbindung mit makroökonomischen Daten und Stimmungsanalysen wurde das Risikokontrollmodul der Strategie verbessert.
- Automatische Optimierung der Parameter durch Machine Learning-Algorithmen, um die Anpassungsfähigkeit und Stabilität der Strategie zu verbessern.
Zusammenfassen
Die VWMA-ADX-Bitcoin-Multi-Header-Strategie ist in der Lage, durch die integrierte Berücksichtigung von mehreren technischen Indikatoren wie Preistrends, Dynamik, Handelsvolumen und anderen, die Aufwärtschancen in den Bitcoin-Markt zu erfassen. Die strengen Risikokontrollen und die klaren Pläne ermöglichen eine bessere Risikokontrolle. Die Strategie hat jedoch auch einige Einschränkungen, wie die mangelnde Anpassungsfähigkeit an Veränderungen der Marktumgebung und die Optimierung der Stop-loss-Strategie.
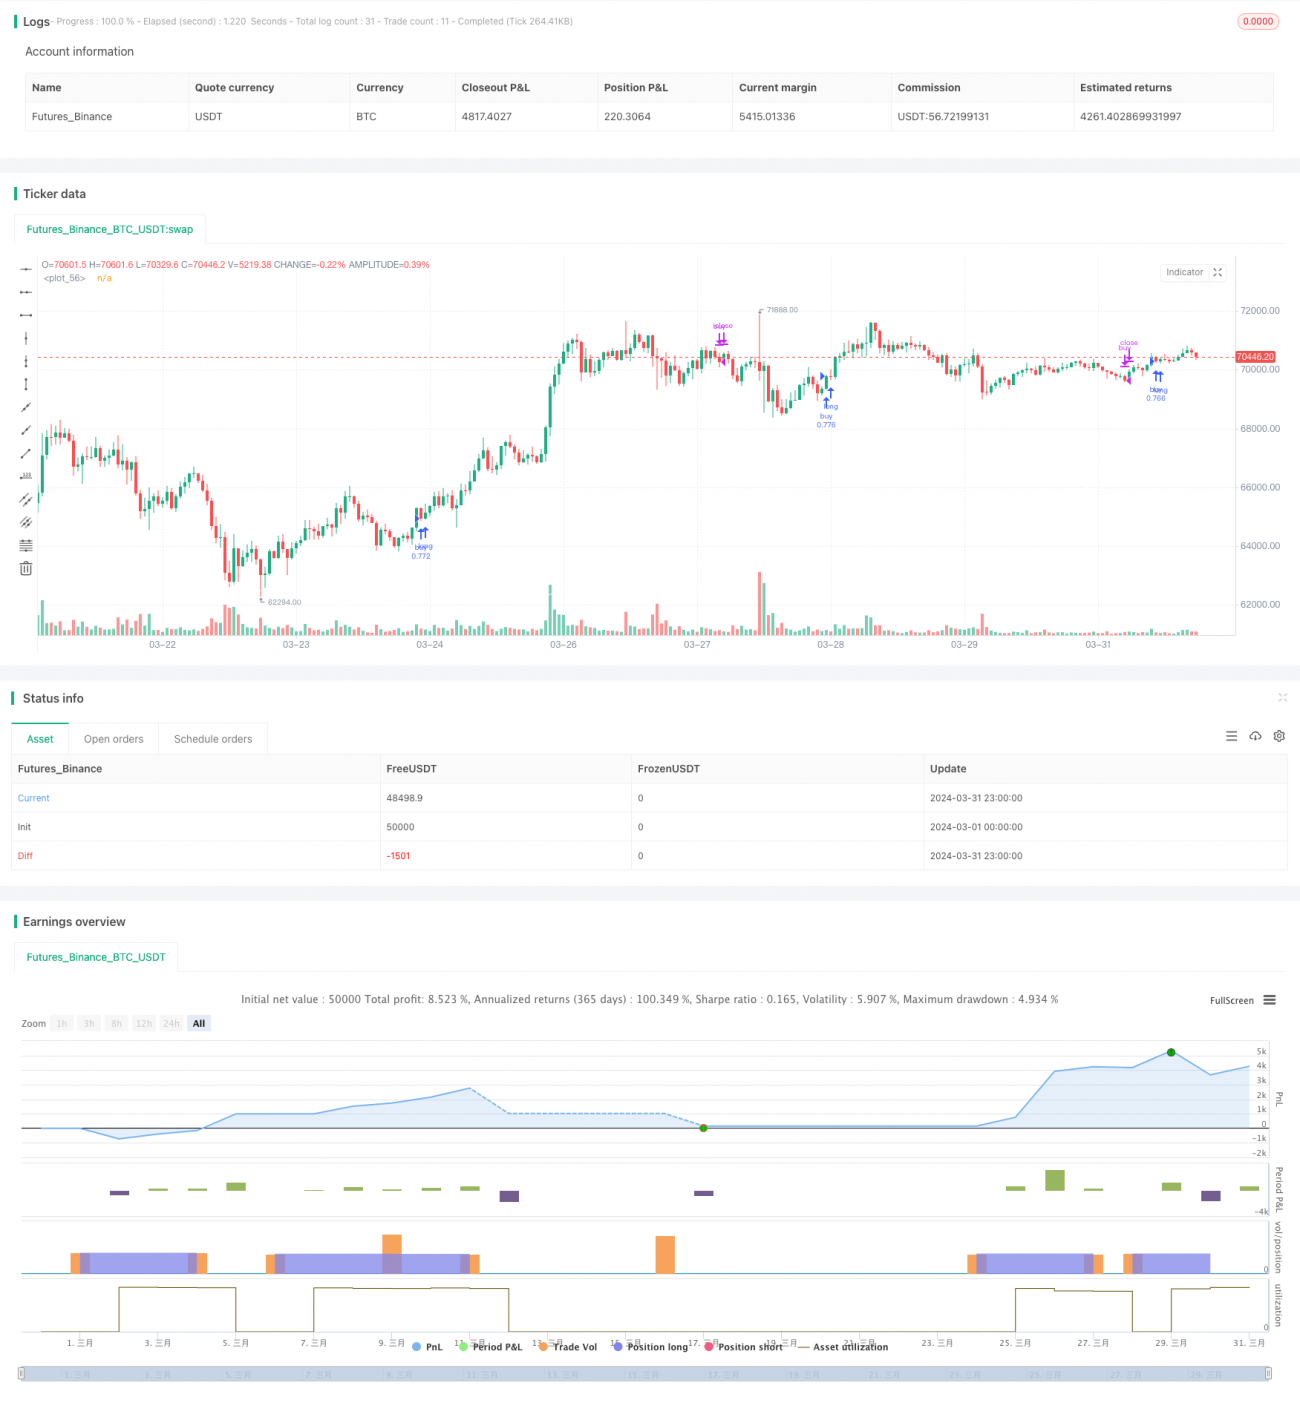
/*backtest
start: 2024-03-01 00:00:00
end: 2024-03-31 23:59:59
period: 1h
basePeriod: 15m
exchanges: [{"eid":"Futures_Binance","currency":"BTC_USDT"}]
*/

// This Pine Script™ code is subject to the terms of the Mozilla Public License 2.0 at https://mozilla.org/MPL/2.0/
// © Q_D_Nam_N_96

//@version=5
- 1