RSI und Bollinger Bands Dual-Strategie

Überblick
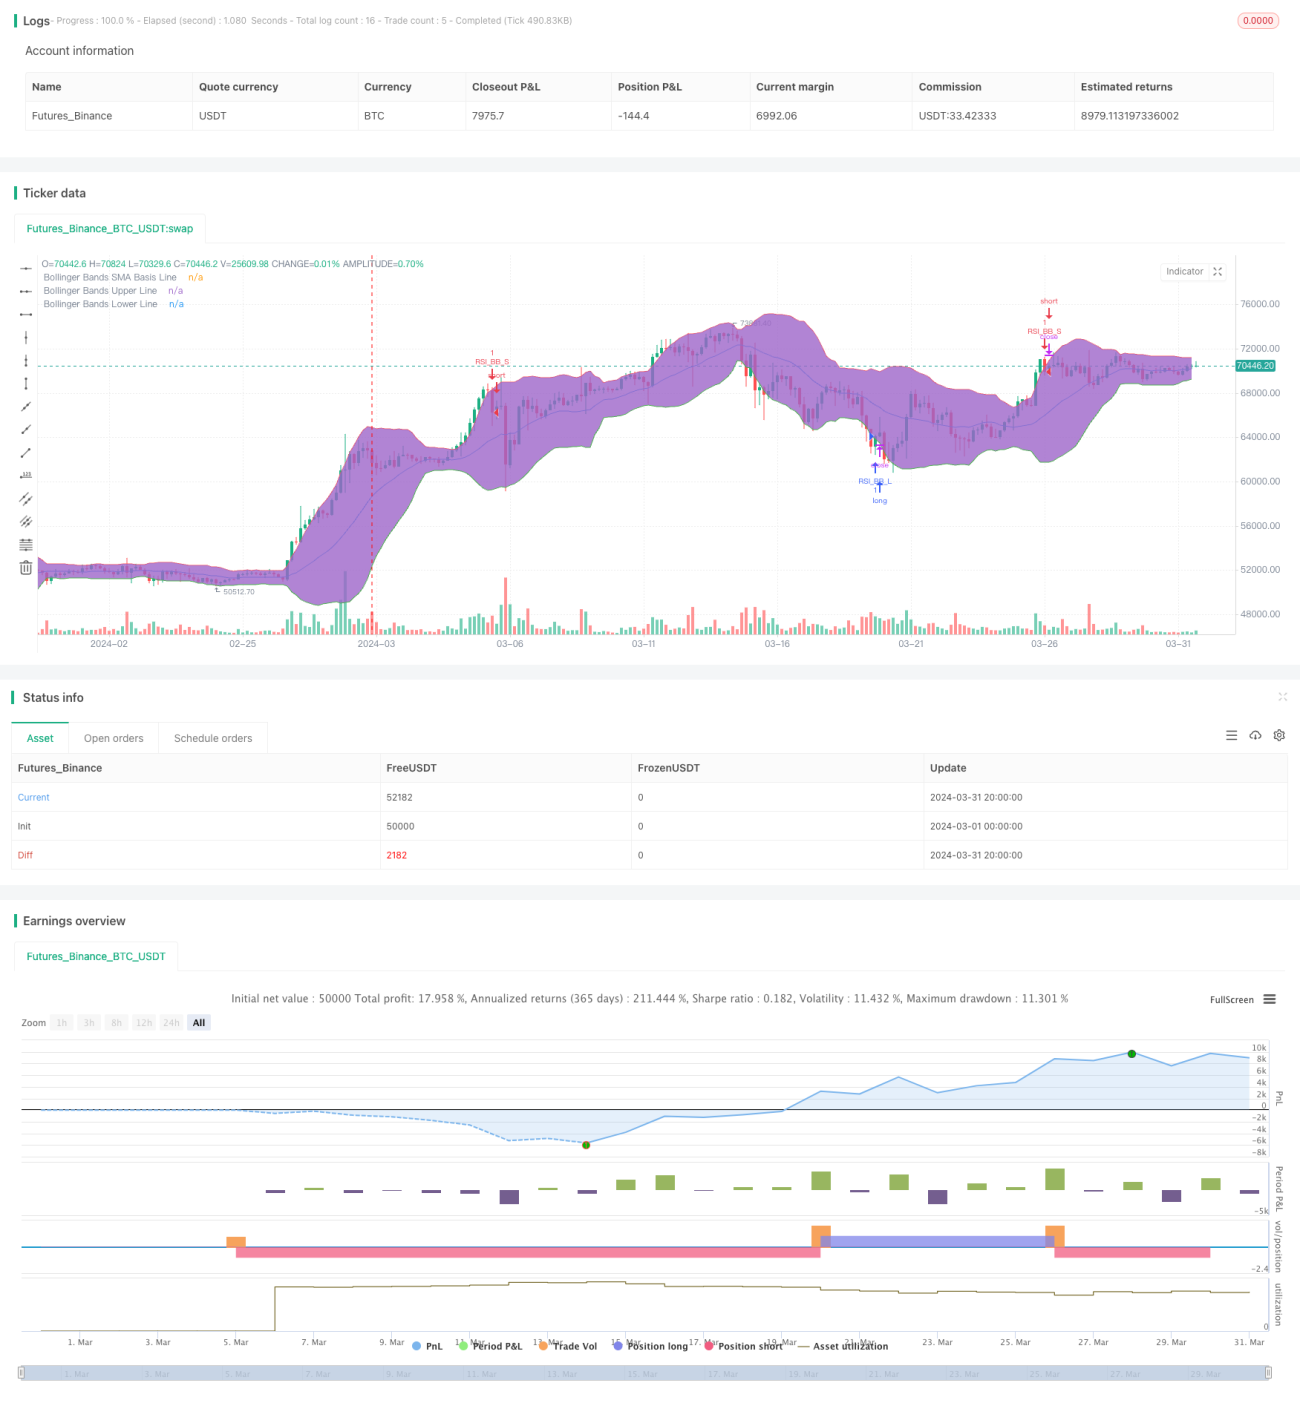
Die Strategie kombiniert zwei technische Indikatoren, den relativ starken Index (RSI) und die Bollinger Bands (Bollinger Bands), um ein Kaufsignal zu erzeugen, wenn der Preis unterhalb der Bollinger Bands unterwegs ist, und ein Verkaufsignal, wenn der Preis über der Bollinger Bands unterwegs ist. Die Strategie löst nur ein Handelssignal aus, wenn der RSI-Indikator und der Bollinger Bands-Indikator gleichzeitig überverkaufen oder überkaufen.
Strategieprinzip
- Berechnung des RSI-Wertes anhand der eingestellten RSI-Parameter.
- Mit der Brin-Band-Formel berechnen Sie die Brin-Band-Mittelbahn, Oberbahn und Unterbahn.
- Beurteilen Sie, ob der aktuelle Schlusskurs die Bollinger Bands auf- oder abtrennend durchbrochen hat.
- Beurteilen Sie, ob der aktuelle RSI-Wert über der Überkauf- oder unter der Überverkaufsschwelle liegt.
- Wenn der Brin-Band und der RSI gleichzeitig eine Kauf- oder Verkaufskondition erfüllen, wird ein entsprechendes Handelssignal erzeugt.
Strategische Vorteile
- Mit der Kombination von Trends und Dynamiken ist es möglich, den Zustand des Marktes umfassender zu beurteilen.
- Die Verwendung von zwei Indikatoren gleichzeitig als Filterbedingungen reduziert die Wahrscheinlichkeit von Falschsignalen.
- Die Code-Logik ist klar, die Parameter sind flexibel eingestellt und passen sich unterschiedlichen Marktumgebungen und Handelsstilen an.
Strategisches Risiko
- In einem wackligen Markt könnte diese Strategie zu einem größeren Verlust führen.
- Die falsche Einstellung der Parameter kann zu einer schlechten Strategieleistung führen, die entsprechend der tatsächlichen Situation optimiert werden muss.
- Die Strategie hat keine Stop-Loss-Einstellung und kann ein höheres Risiko für einen Rückzug darstellen.
Richtung der Strategieoptimierung
- Die Parameter des RSI und der Brin-Band können je nach Markteigenschaften und persönlichen Vorlieben optimiert werden.
- Die Einführung anderer technischer Indikatoren wie MACD, Durchschnittslinie usw. erhöht die Zuverlässigkeit des Signals.
- Setzen Sie angemessene Stop-Loss- und Stop-Stops und kontrollieren Sie das Risiko für einzelne Geschäfte.
- Bei einem schwankenden Markt kann man überlegen, die Beurteilungsbedingungen zu erhöhen oder die Positionen zu reduzieren, um die Kosten für häufige Transaktionen zu senken.
Zusammenfassen
Die RSI- und Brin-Band-Doppelstrategie kann die Marktlage durch die Kombination von Trend- und Dynamikindikatoren vergleichsweise umfassend beurteilen und entsprechende Handelssignale geben. Die Strategie kann jedoch in einem schwankenden Markt schlecht abschneiden und keine Risikokontrollen eingerichtet haben, so dass Vorsicht bei der Anwendung auf dem Markt erforderlich ist. Die Stabilität und Profitabilität der Strategie können durch Optimierung der Parameter, Einführung anderer Indikatoren und Einrichtung einer vernünftigen Stop-Loss-Schranke weiter verbessert werden.
/*backtest
start: 2024-03-01 00:00:00
end: 2024-03-31 23:59:59
period: 4h
basePeriod: 15m
exchanges: [{"eid":"Futures_Binance","currency":"BTC_USDT"}]
*/

//@version=4
strategy("Bollinger + RSI, Double Strategy (by ChartArt) v1.1", shorttitle="CA_-_RSI_Bol_Strat_1.1", overlay=true)

// ChartArt's RSI + Bollinger Bands, Double Strategy - Update- 1