Gleitender Durchschnitt Crossover Mehrschichtige Gewinnstrategie

Überblick
Die Strategie nutzt die Kreuzung von zwei Moving Averages, um die Markttrends zu beurteilen, und öffnet Positionen, wenn die langfristigen Moving Averages auf den kurzfristigen Moving Averages überschritten werden. Gleichzeitig verwendet die Strategie die Methode der mehrstufigen Gewinnschließung, indem sie die Positionen in Gruppen platziert, wenn der Preis das gewünschte Gewinnniveau erreicht, um die Gewinne zu maximieren und das Risiko zu kontrollieren.
Strategieprinzip
Der Kern der Strategie ist die Verwendung von Moving Averages in verschiedenen Perioden, um Markttrends zu erfassen. Wenn der kurzfristige Moving Average über den langfristigen Moving Average geht, bedeutet dies, dass der Markt möglicherweise in einen Aufwärtstrend eintritt, wodurch mehr Positionen eröffnet werden. Wenn der kurzfristige Moving Average unter dem langfristigen Moving Average geht, bedeutet dies, dass der Markt möglicherweise in einen Abwärtstrend eintritt, wodurch offene Positionen eröffnet werden.
Strategische Vorteile
- Einfach und effektiv: Die Strategie basiert auf dem klassischen Prinzip der Kreuzung von Moving Averages und ist einfach und verständlich und hat sich in der Praxis bewährt.
- Multiple Profit-Levels: Durch die Einrichtung mehrerer Profit-Levels und die Erreichung dieser Niveaus durch die Erschließung von Positionen in Folge, können die Gewinne maximiert und die Risiken kontrolliert werden.
- Flexible Parameter: Die Parameter der Strategie sind so flexibel, dass der Benutzer die Moving Average-Periode und den Gewinngrad anpassen kann, um die besten Ergebnisse zu erzielen, je nach eigenen Bedürfnissen und Markteigenschaften.
Strategisches Risiko
- Risiken von Marktschwankungen: Häufige Kreuzungen von Signalen können zu häufigen Strategietransaktionen führen, was zu erhöhten Transaktionskosten und Rücknahmerisiken führt, wenn die Märkte stark schwanken.
- Risiken bei der Parameter-Einstellung: Die falsche Parameter-Einstellung kann zu einer schlechten Strategie führen, z. B. falsche Wahl der Moving-Average-Periode oder unvernünftige Einstellung der Gewinn-Level.
- Trenderkennungsrisiken: Diese Strategie ist stark auf Trends angewiesen und kann zu Verlusten führen, wenn sich der Markt im Aufruhr befindet oder die Trends unklar sind.
Richtung der Strategieoptimierung
- Kombination mit anderen Indikatoren: Eine Kombination mit anderen technischen Indikatoren wie RSI, MACD usw. kann in Betracht gezogen werden, um die Genauigkeit und Zuverlässigkeit der Trenderkennung zu verbessern.
- Optimierungsparameter: Durch Rückverfolgung und Optimierung können die optimalen Moving-Average-Perioden und Profitabilitätsparameter für unterschiedliche Marktbedingungen gefunden werden.
- Einsatz von Stop-Loss: Ein Einsatz von Stop-Loss-Mechanismen zur weiteren Risikokontrolle kann in Betracht gezogen werden, z. B. dynamische Stop-Loss-Einstellungen gemäß ATR.
- Ein- und Ausstiegs-Veränderungen: Es können weitere Ein- und Ausstiegsbedingungen erforscht werden, z. B. die Berücksichtigung von Faktoren wie Handelsvolumen, Unterstützungswiderstand, um die Stabilität der Strategie zu verbessern.
Zusammenfassen
Die Moving Average Crossover Multiple-Layer-Reward-Strategie ist eine einfache und wirksame Trend-Tracking-Strategie, mit der mehrere Stufen von Gewinnschlüssen erzielt werden können, um mehr Gewinne in den Trends zu erzielen und gleichzeitig Risiken zu kontrollieren. Die Strategie weist jedoch auch einige Einschränkungen und Risiken auf, die je nach spezifischen Marktbedingungen und Benutzerbedürfnissen optimiert und verbessert werden müssen.
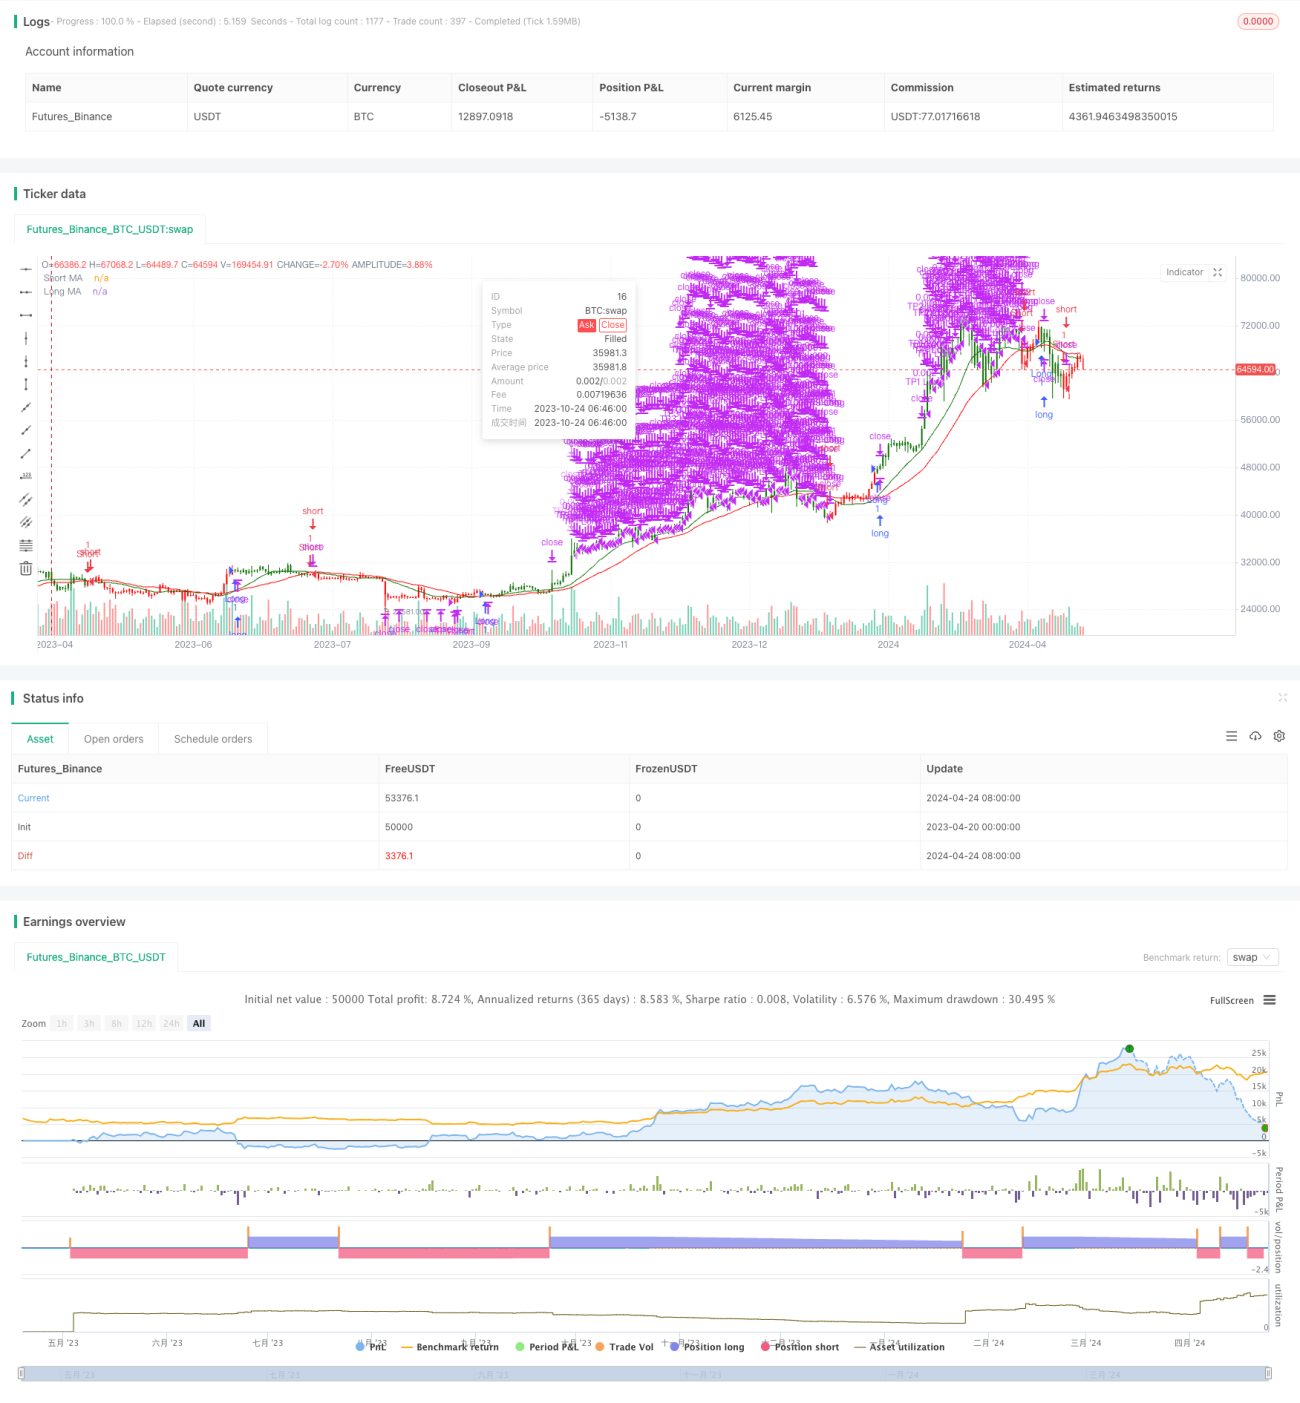
/*backtest
start: 2023-04-20 00:00:00
end: 2024-04-25 00:00:00
period: 1d
basePeriod: 1h
exchanges: [{"eid":"Futures_Binance","currency":"BTC_USDT"}]
*/

// This Pine Script™ code is subject to the terms of the Mozilla Public License 2.0 at https://mozilla.org/MPL/2.0/
// © ValdesTradingBots

//Follow Us for More Insights and Updates!- 1