RSI und Double EMA Crossover Signal Quantitative Strategie

Überblick
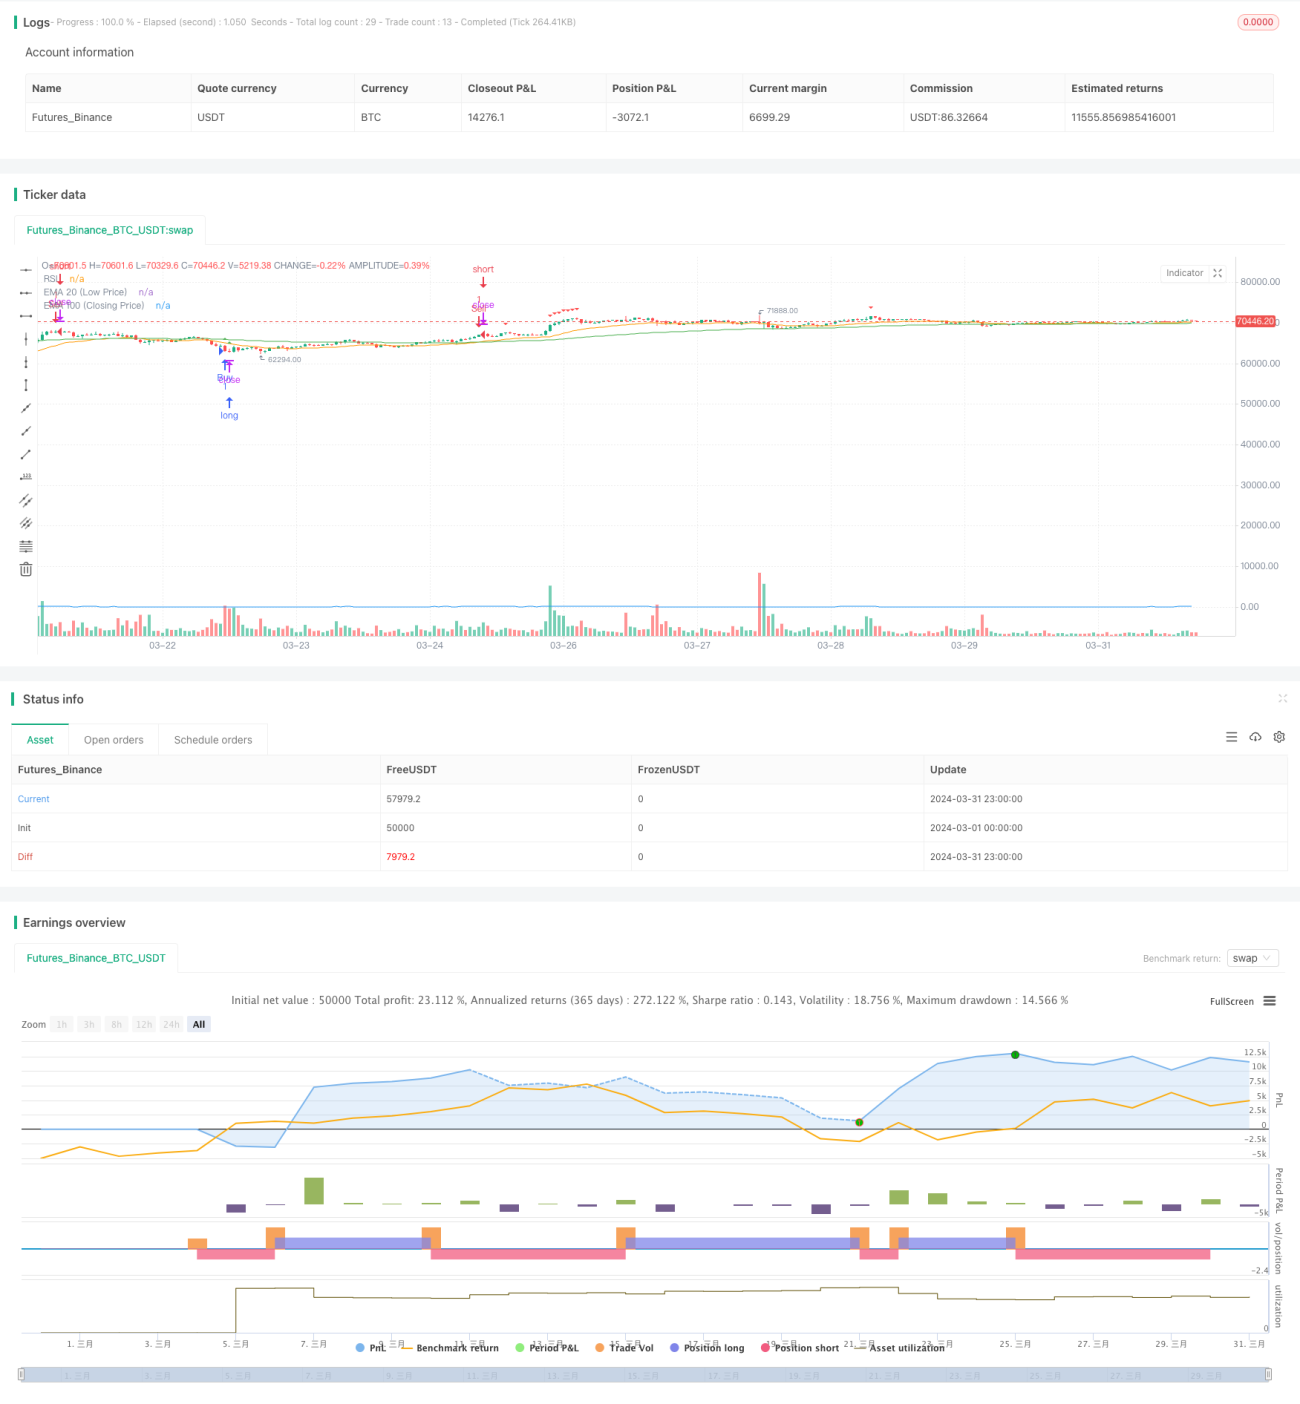
Die Strategie basiert auf dem RSI-Indikator und dem Kreuzungssignal der beiden EMA-Linien, um den Kauf- und Verkaufspunkt zu bestimmen. Es erzeugt ein Kaufsignal, wenn der Schließungspreis unter EMA100 und EMA20 fällt und der RSI-Wert unter 30 liegt. Es erzeugt ein Verkaufssignal, wenn der Schließungspreis die EMA100 und EMA20 durchbricht und der RSI über 70 liegt.
Strategieprinzip
- Der RSI-Wert wird berechnet, um zu beurteilen, ob ein Markt überkauft oder überverkauft ist. Wenn der RSI unter 30 liegt, wird er als Überverkaufsplatz angesehen, und wenn er über 70 liegt, wird er als Überkaufsplatz angesehen.
- Berechnen Sie die mittleren Linien EMA100 für den Schlusskurs und EMA20 für den Tiefstkurs als Grundlage für die Trendbeurteilung.
- Wenn der Schlusskurs unterhalb der EMA100 und EMA20 liegt und der RSI unter 30 liegt, wird er als Überverkauf bezeichnet und tritt nach unten, um ein Kaufsignal zu erzeugen.
- Wenn der Schlusskurs die EMA100 und EMA20 überschreitet und der RSI-Wert über 70 liegt, wird er als Überkauf bezeichnet und tritt nach oben, was zu einem Verkaufssignal führt.
- Kaufen Sie, wenn ein Signal ausgelöst wird, und verkaufen Sie, wenn ein Signal ausgelöst wird.
Analyse der Stärken
- Die Kombination des RSI mit dem EMA-Mittelwert ermöglicht eine bessere Beurteilung von Trendwendepunkten und Überkauf-Überverkaufszeiten, wodurch falsche Signale reduziert werden.
- Die Parameter sind einstellbar und optimierbar für verschiedene Standards und Perioden, mit einer gewissen Anpassungsfähigkeit und Flexibilität.
- Die Logik ist einfach und klar, leicht zu verstehen und zu implementieren, ohne viel technische Analyse zu benötigen.
- Das System ist geeignet, um Schwankungen zu erfassen und die Differenz zwischen den Preisen zu nutzen.
Risikoanalyse
- Bei einseitigen Trends kann es zu Fehlschlägen kommen, da nach der Trendbildung immer wieder falsche Signale erzeugt werden.
- Die Parameter sind fest, es fehlt die Fähigkeit, sich dynamisch an die Märkte anzupassen, und sie sind anfällig für Veränderungen des Marktrhythmus.
- Häufige Transaktionen in unbeständigen Zeiten können zu hohen Slippoints und Gebühren führen, die sich auf die strategischen Erträge auswirken.
- Es fehlen Risikomanagement und Risikokontrollen, Rücknahmen und maximale Verluste sind unkontrollierbar.
Optimierungsrichtung
- Trendbeurteilungskriterien, wie MA-Crossing, DMI usw. aufzunehmen, um eine vorzeitige Eintritt in einseitige Trends zu vermeiden.
- Optimierung der RSI- und EMA-Parameter, um die am besten geeignete Kombination von Standard- und Periodensymbolen zu finden und die Signalgenauigkeit zu verbessern.
- Die Einführung von Positionsmanagementmodellen wie ATR-Positionen oder Kelly-Formeln, um den Kapitalanteil pro Handel zu kontrollieren und das Risiko zu verringern.
- Setzen Sie Stop-Loss- und Stop-Off-Bedingungen, wie z. B. einen festen Prozentsatz Stop-Off oder einen mobilen Stop-Off, um den maximalen Verlust und die Gewinnwiedergabe für einen einzelnen Handel zu steuern.
- In Kombination mit anderen Hilfsindikatoren wie MACD, Brinband usw. erhöht sich die Signalbestätigung und verringert die Fehleinschätzung.
Zusammenfassen
Die RSI- und EMA-Cross-Signal-Quantifizierungsstrategie ist eine einfache, praktische Quantifizierungsstrategie, die durch die Kombination des RSI-Indikators mit der EMA-Gleichgewichtung die Höhen und Tiefen in einem wackligen Umfeld besser erfasst und differenziert. Die Strategie hat jedoch auch einige Einschränkungen und Risiken, wie z. B. die Ausfallwirkung in einem Trendumfeld, das Fehlen von Positionsmanagement- und Risikokontrollmaßnahmen usw.
- 1