Dreifache EMA Crossover-Strategie

Überblick
Die Triple EMA-Cross-Strategie ist eine Strategie, bei der der Handel auf der Grundlage von EMA-Crosssignalen aus drei verschiedenen Perioden erfolgt. Die Strategie nutzt die schnellen EMA (10 Perioden), die mittleren EMA (25 Perioden) und die langsamen EMA (50 Perioden), um Markttrends zu erfassen, während die mittlere tatsächliche Breite (ATR) verwendet wird, um Stop-Loss- und Stop-Levels für verschiedene Marktschwankungen einzustellen. Wenn die schnellen EMA über die langsamen EMA kreuzt und die mittleren EMA auch über die langsamen EMA, erzeugt dies ein bullish Signal.
Strategieprinzip
- Berechnen Sie die EMA für drei verschiedene Perioden: schnelle (10 Perioden), mittlere (25 Perioden) und langsame (50 Perioden).
- Wenn die schnelle EMA von oben nach unten durch die langsame EMA geht und die mittelschnelle EMA über der langsamen EMA liegt, erzeugt sie ein Schlagzeilen-Kreuzsignal.
- Wenn ein schneller EMA den schnellen EMA von oben nach unten durchquert und ein mittlerer EMA unter dem schnellen EMA liegt, erzeugt dies ein bullish-cross-signal.
- Der ATR wird verwendet, um die dynamischen Stop-Loss- und Stop-Stop-Levels zu berechnen, wobei die Stop-Loss-Einstellung 3-mal so hoch ist wie die ATR und die Stop-Stop-Einstellung 6-mal so hoch ist wie die ATR.
- Wenn Sie das Signal von einer Kreuzung sehen, machen Sie eine Überposition und setzen Sie Stop-Loss und Stop-Stop.
- Wenn ein Kurs-Cross-Signal auftritt, wird die Position aufgelöst und ein Stop-Loss und ein Stop-Stop eingestellt.
Strategische Vorteile
- Die Triple EMA-Cross-Strategie filtert effektiv Marktlärm und konzentriert sich auf die Erfassung der wichtigsten Trends.
- Durch die Verwendung von EMAs in verschiedenen Zyklen kann die Strategie schneller auf Preisänderungen reagieren und gleichzeitig sicherstellen, dass die Signale von mittleren und langfristigen Trends unterstützt werden.
- Die ATR wird verwendet, um die Stop-Loss- und Stop-Out-Levels dynamisch anzupassen, um die Strategie an unterschiedliche Marktschwankungen anzupassen und die Effektivität des Risikomanagements zu verbessern.
Strategisches Risiko
- In einem unruhigen oder hochschwankenden Markt kann diese Strategie falsche Signale erzeugen, was zu häufigen Transaktionen und potenziellen Verlusten führt.
- Die Performance der Strategie hängt in hohem Maße von der Wahl des EMA-Zyklus ab, und eine unangemessene Parameter-Einstellung kann zu einer Verringerung der Signalqualität führen.
- Eine vollständige Analyse des Marktes kann nicht allein auf die Kreuzung von Moving Averages beruhen, sondern muss in Verbindung mit anderen technischen Indikatoren verwendet werden, um Trends und Signale zu bestätigen.
Richtung der Strategieoptimierung
- Erwägen Sie die Einführung anderer technischer Indikatoren, wie der Relative Strength Index (RSI) oder Stochastic (Stochastic), um die Effektivität von Trends und Kreuzungen zu bestätigen.
- Parameteroptimierungstests für verschiedene Marktsituationen und Assetklassen zur Ermittlung der optimalen EMA-Zykluskombination und ATR-Multiplier-Einstellungen.
- Einführung von Risikomanagement-Maßnahmen, wie Positionsgröße basierend auf der dynamischen Marktvolatilität zu ändern oder den Handel unter bestimmten Marktbedingungen zu beenden, um das Risiko weiter zu kontrollieren.
Zusammenfassen
Die Triple EMA-Cross-Strategie bietet Händlern eine effektive Methode zur Trendverfolgung und Risikomanagement durch die Nutzung von Index-Moving-Average-Cross-Signalen in verschiedenen Zyklen in Kombination mit ATR-Dynamischen Stop-Loss- und Stop-Settings. Obwohl die Strategie in Trendmärkten gut funktioniert, kann sie in einem turbulenten Markt eine Herausforderung darstellen.
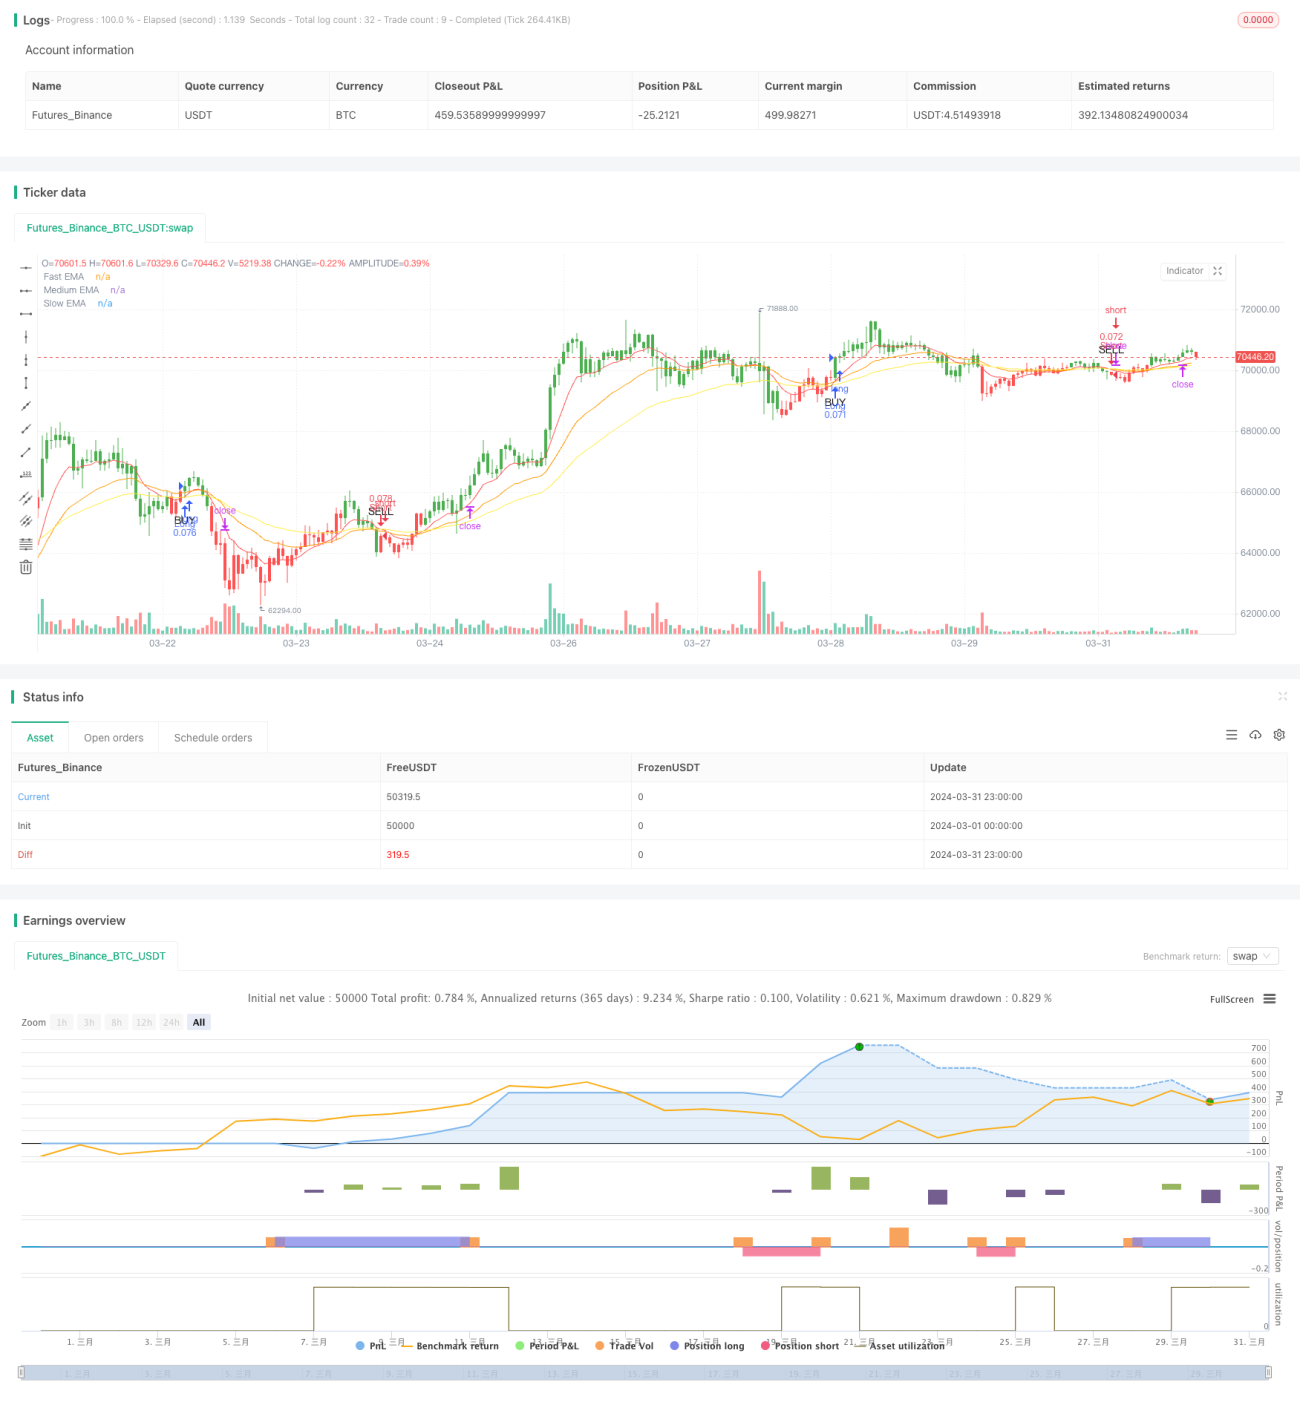
/*backtest
start: 2024-03-01 00:00:00
end: 2024-03-31 23:59:59
period: 1h
basePeriod: 15m
exchanges: [{"eid":"Futures_Binance","currency":"BTC_USDT"}]
*/

//@version=5
strategy("Triple EMA Crossover Strategy", overlay=true, default_qty_type=strategy.percent_of_equity, default_qty_value=10)

// Input for EMA periods- 1