
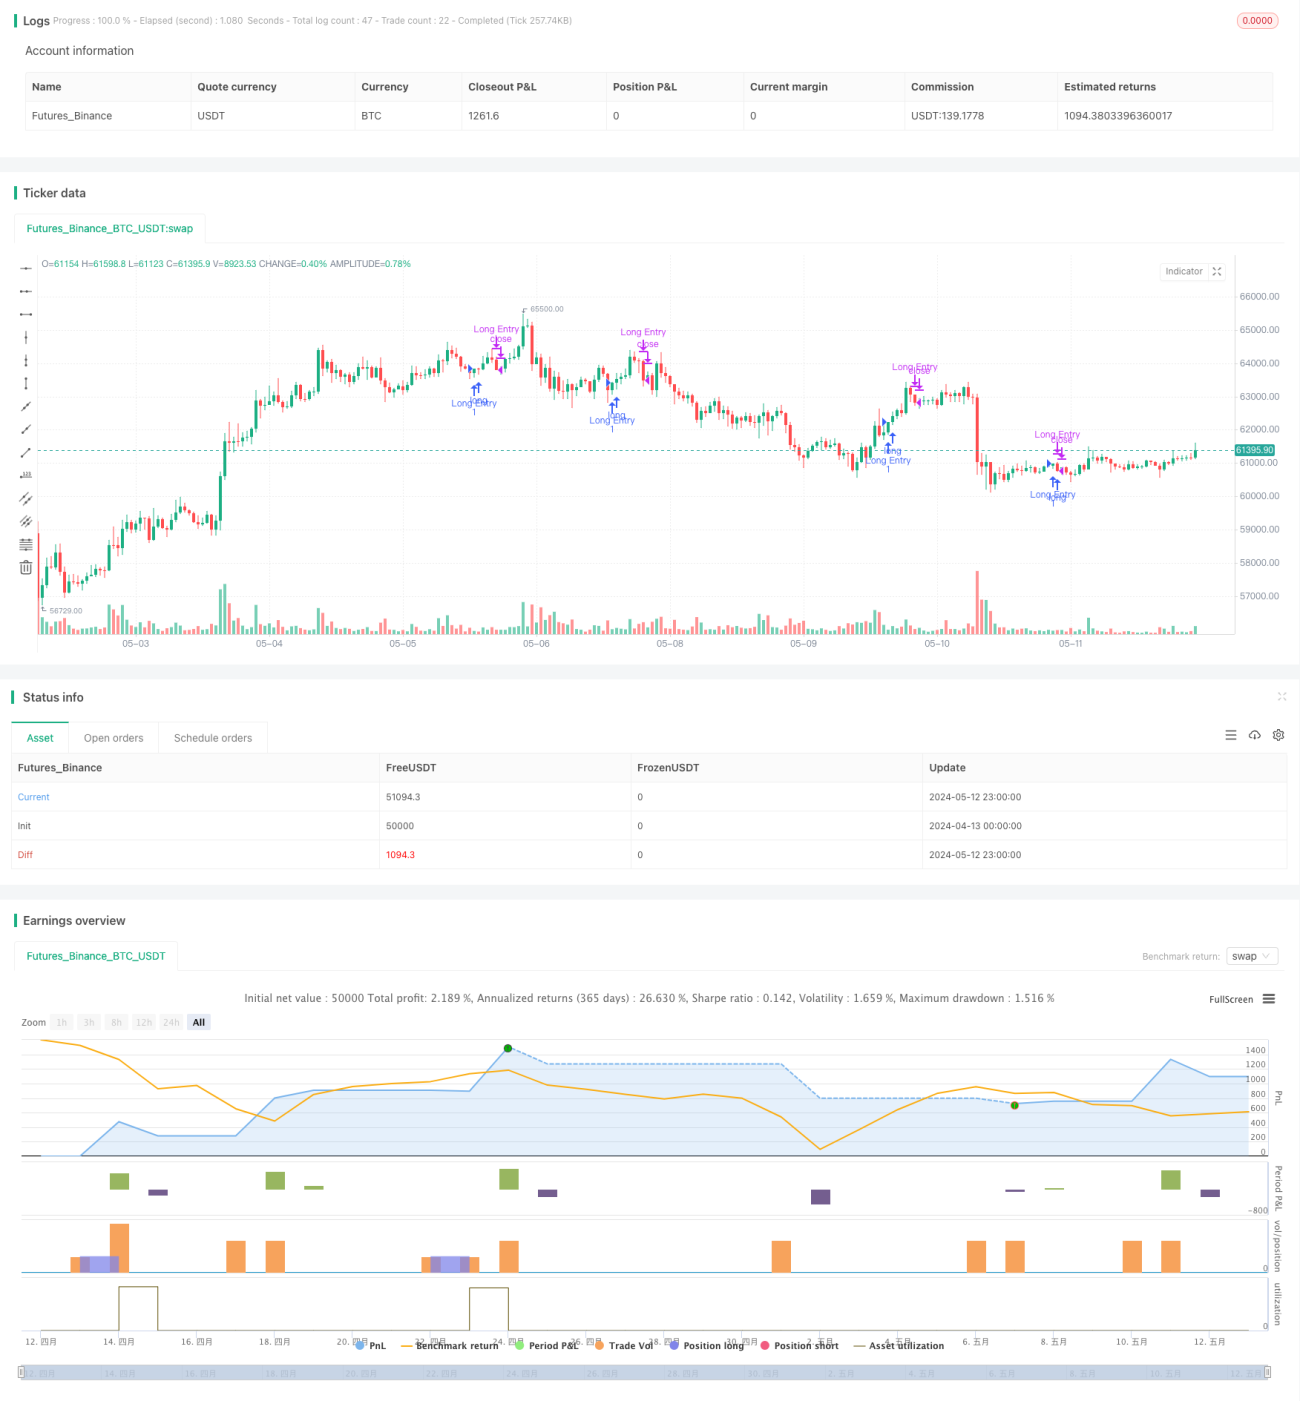
Überblick
Die Hauptidee dieser Strategie besteht darin, bullische Kerzen ohne obere Dochte als Kaufsignale zu identifizieren und Positionen zu schließen, wenn der Kurs das Tief der vorherigen Kerze unterschreitet. Die Strategie nutzt die Eigenschaft bullischer Kerzen mit sehr kleinen oberen Dochten, was auf eine starke bullische Dynamik und eine höhere Wahrscheinlichkeit weiterer Kurssteigerungen hindeutet. Gleichzeitig dient das Tief der vorherigen Kerze als Stop-Loss-Niveau, um das Risiko effektiv zu kontrollieren.
Strategieprinzipien
- Feststellung, ob die aktuelle Kerze eine bullische Kerze ist (Schlusskurs höher als Eröffnungskurs)
- Berechnung des Verhältnisses der Länge des oberen Dochts der aktuellen Kerze zur Länge ihres Kerzenkörpers
- Wenn das Verhältnis des oberen Dochts weniger als 5 % beträgt, wird dies als gültige bullische Kerze ohne oberen Docht betrachtet und ein Kaufsignal generiert
- Nach dem Kauf wird das Tief der vorherigen Kerze als Stop-Loss-Niveau festgehalten
- Wenn der Kurs das Stop-Loss-Niveau unterschreitet, wird die Position geschlossen und beendet
Strategievorteile
- Durch die Auswahl bullischer Kerzen ohne obere Dochte für den Einstieg ist die Trendstärke größer und die Erfolgsquote höher
- Durch die Nutzung des Tiefs der vorherigen Kerze als Stop-Loss-Niveau bleibt das Risiko kontrollierbar
- Einfache Logik, leicht zu implementieren und zu optimieren
- Geeignet für den Einsatz in Trendmärkten
Strategierisiken
- Es kann vorkommen, dass auf ein Kaufsignal sofort ein Rücksetzer folgt, der den Stop-Loss auslöst
- Bei hochvolatilen Instrumenten kann das Stop-Loss-Niveau zu nah am Kaufpreis liegen, was zu vorzeitigen Ausstiegen führt
- Fehlende Gewinnziele erschweren das Erkennen des optimalen Ausstiegszeitpunkts
Optimierungsrichtungen der Strategie
- Kombination mit anderen Indikatoren wie MA, MACD usw., um die Trendstärke zu bestätigen und die Effektivität der Einstiegssignale zu verbessern
- Bei hochvolatilen Instrumenten kann das Stop-Loss-Niveau weiter entfernt gesetzt werden, z. B. auf das Tief der vorherigen N Kerzen, um die Stop-Loss-Häufigkeit zu verringern
- Einführung von Gewinnzielen, z. B. N-faches ATR oder prozentuale Gewinne, um Gewinne rechtzeitig zu sichern
- Berücksichtigung eines Positionsmanagements, z. B. Anpassung der Positionsgröße basierend auf der Signalstärke
Zusammenfassung
Diese Strategie erfasst Gewinne effektiv in Trendmärkten, indem sie bullische Kerzen ohne obere Dochte für den Einstieg auswählt und das Tief der vorherigen Kerze als Stop-Loss nutzt. Allerdings hat die Strategie auch gewisse Einschränkungen, wie unflexible Stop-Loss-Platzierung und fehlende Gewinnziele. Verbesserungen können durch die Einführung anderer Indikatoren zur Signalfilterung, Optimierung der Stop-Loss-Positionen und Festlegung von Gewinnzielen erzielt werden, um die Strategie robuster und effektiver zu gestalten.
Overview
The main idea of this strategy is to find bullish candles without upper wicks as buy signals and close positions when the price breaks below the low of the previous candle. The strategy utilizes the characteristic of bullish candles with very small upper wicks, indicating strong bullish momentum and a higher probability of continued price increases. At the same time, using the low of the previous candle as a stop-loss level can effectively control risk.
Strategy Principles
- Determine if the current candle is a bullish candle (close price higher than open price)
- Calculate the ratio of the current candle's upper wick length to its body length
- If the upper wick ratio is less than 5%, consider it a valid bullish candle without an upper wick and generate a buy signal
- Record the lowest price of the previous candle after buying as the stop-loss level
- When the price breaks below the stop-loss level, close the position and exit
Strategy Advantages
- Selecting bullish candles without upper wicks for entry, the trend strength is greater and the success rate is higher
- Using the low of the previous candle as the stop-loss level, risks are controllable
- Simple logic, easy to implement and optimize
- Suitable for use in trending markets
Strategy Risks
- There may be cases where a buy signal is followed by an immediate pullback triggering the stop-loss
- For highly volatile instruments, the stop-loss level may be set too close to the buy price, leading to premature stop-outs
- Lack of profit targets, making it difficult to grasp the optimal exit timing
Strategy Optimization Directions
- Combine with other indicators such as MA, MACD, etc., to confirm trend strength and improve the effectiveness of entry signals
- For highly volatile instruments, set the stop-loss level at a further position, such as the lowest point of the previous N candles, to reduce the stop-loss frequency
- Introduce profit targets, such as N times ATR or percentage gains, to lock in profits in a timely manner
- Consider adding position management, such as adjusting position size based on signal strength
Summary
This strategy captures profits effectively in trending markets by selecting bullish candles without upper wicks for entry and using the low of the previous candle for stop-loss. However, the strategy also has certain limitations, such as inflexible stop-loss placement and lack of profit targets. Improvements can be made by introducing other indicators to filter signals, optimizing stop-loss positions, and setting profit targets to make the strategy more robust and effective.
- 1