Bollinger Bands ATR Trendfolgestrategie

Überblick
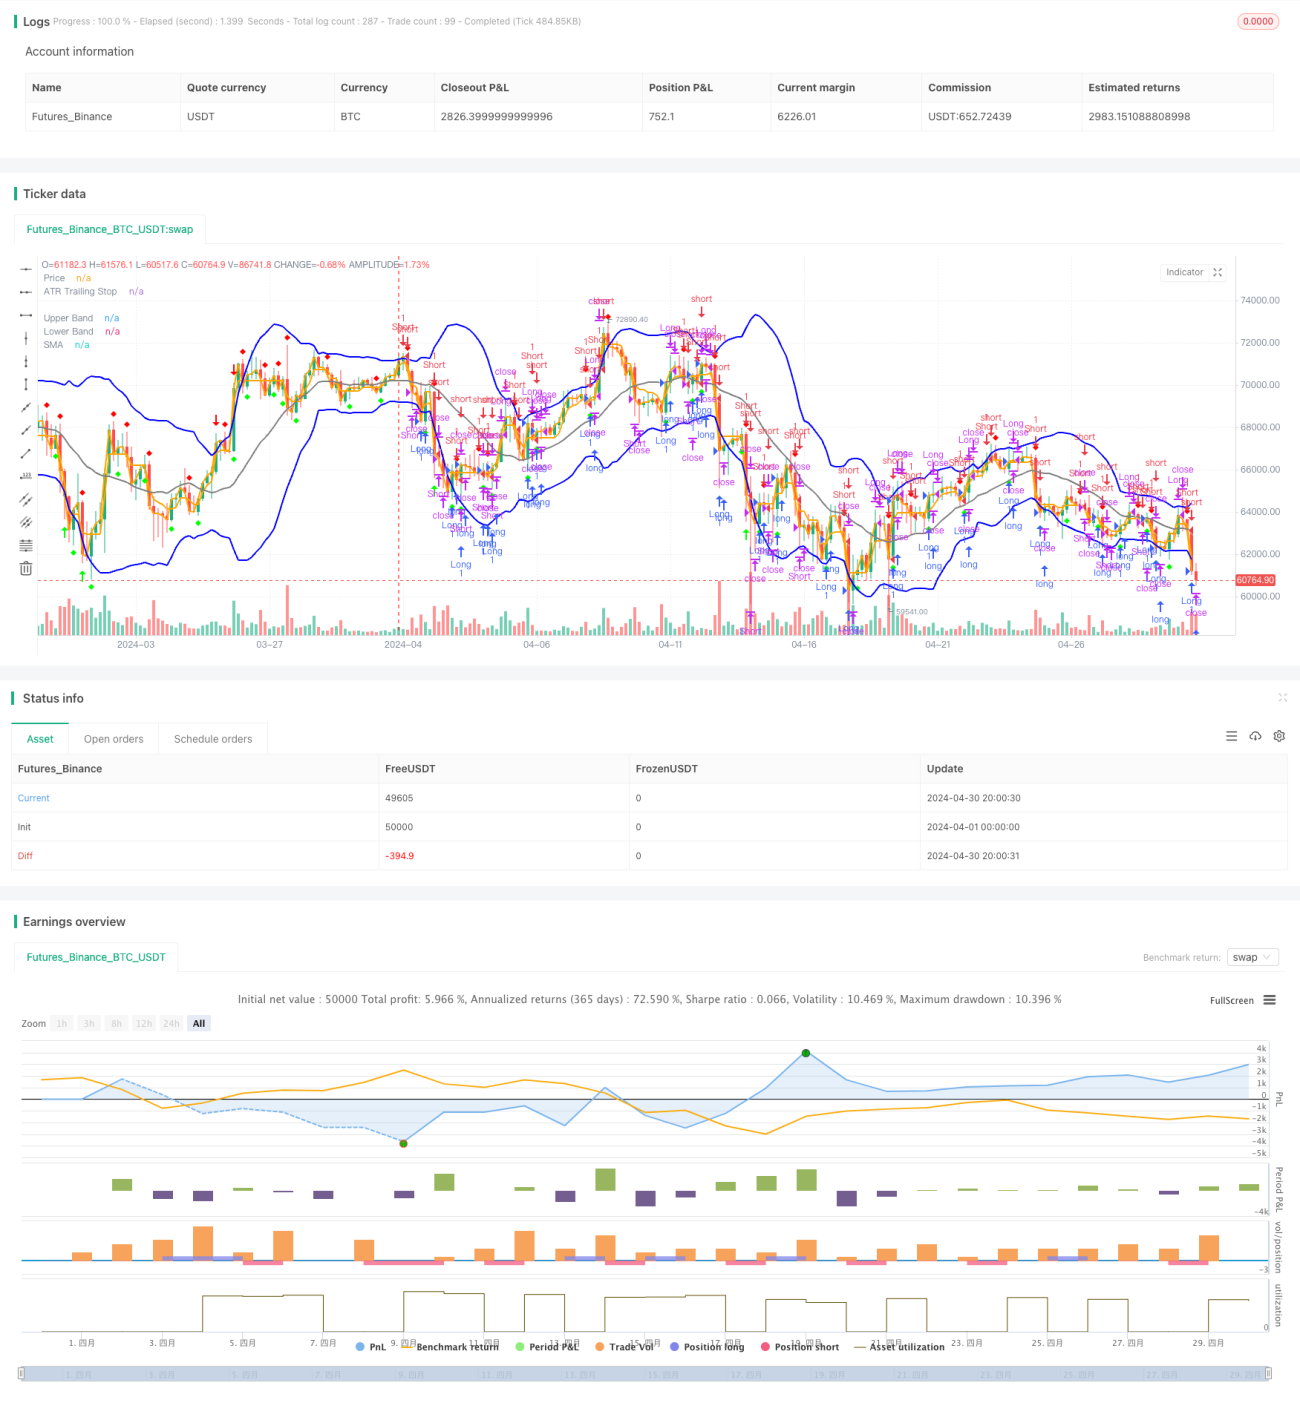
Die Strategie basiert auf den Brin- und ATR-Indikatoren und erfasst die Bandbreite der Preise über die Brin-Band, nutzt den Preisbruch der Brin-Band auf die Unterbahn als Positionssignal, nutzt den ATR als beweglichen Stopp und schließt mit dem Preisbruch des einfachen beweglichen Durchschnitts als Positionssignal. Die Strategie versucht, die Trendlage zu erfassen, Positionen in der Richtung des Trends zu erstellen und bei einer Trendumkehr die Position zu halten.
Strategieprinzip
- Berechnung der Brin-Band: Berechnung des Schlusskurses mit dem einfachen Moving Average (SMA) als Brin-Band-Mittelbahn und Berechnung des Auf- und Abstiegs nach der Schwankungsrate (Standarddifferenz).
- Berechnung des ATR: Die Berechnung des ATR erfolgt anhand des Moving Average der realen Bandbreite (TR) als Grundlage für den Moving Stop.
- Erzeugen Sie ein Handelssignal: Erzeugen Sie ein Mehr-Signal, wenn der Preis nach unten durch die Bollinger Bands nach unten geht, und ein Bremssignal, wenn der Preis nach oben durch die Bollinger Bands auf die Bahn geht; Erzeugen Sie ein Mehr-Signal, wenn der Preis nach oben durch den ATR-Moving Stop geht, und ein Bremssignal, wenn der Preis nach unten durch den ATR-Moving Stop geht.
- Plain Position: Bei einer Mehrpositionsposition ist der Kurs flach, wenn der Preis den einfachen gleitenden Durchschnitt nach oben überschreitet. Bei einer Leerposition ist der Kurs flach, wenn der Preis den einfachen gleitenden Durchschnitt nach unten überschreitet.
Strategische Vorteile
- Trend-Tracking: Trends werden über Brin-Bands und ATR-Mobilstopps erfasst und an unterschiedliche Marktumstände angepasst.
- Pünktliche Stop-Loss: Mit ATR als mobile Stop-Loss kann die Stop-Loss-Position dynamisch an die Marktschwankungen angepasst werden, um das Risiko zu kontrollieren.
- Einfach und benutzerfreundlich: klare Strategie-Logik, weniger Parameter, leicht zu verstehen und anzuwenden.
Strategisches Risiko
- Parameter-sensibel: Die Parameter-Auswahl von Brinband und ATR beeinflusst die Strategie-Performance und muss für verschiedene Märkte und Sorten optimiert werden.
- In einem unsicheren Marktumfeld können häufige Handelssignale zu hohen Transaktionszahlen und Kosten führen.
- Trendwechsel: Die Strategie kann zu einem größeren Rückzug führen, wenn der Trend sich umkehrt.
Richtung der Strategieoptimierung
- Parameteroptimierung: Optimierung der Parameter von Brinband und ATR, um die optimale Kombination von Parametern für verschiedene Märkte und Sorten zu finden.
- Filter: Hinzufügen von anderen technischen Indikatoren oder Preisverhaltensmustern als Filter, um Fehleinschätzungen zu reduzieren und die Signalqualität zu verbessern.
- Positionsverwaltung: Positionsverwaltung, bei der die Positionen dynamisch angepasst werden, um die Kapitalnutzungs-Effizienz und das Ertrags-Risiko-Verhältnis zu verbessern, je nach Marktvolatilität oder Konto-Risiko.
Zusammenfassen
Die Brin-Band-ATR-Trend-Tracking-Strategie erfasst die Trendentwicklung über die Brin-Band- und ATR-Indikatoren und bietet die Vorteile von Trendverfolgung, rechtzeitigen Stopps und einfacher Benutzung. Gleichzeitig bestehen jedoch Risiken wie Parameterempfindlichkeit, Marktschock und Trendumkehr. Die Strategie kann durch Parameteroptimierung, Hinzufügen von Filtern und Positionsmanagement weiter optimiert werden.
- 1