
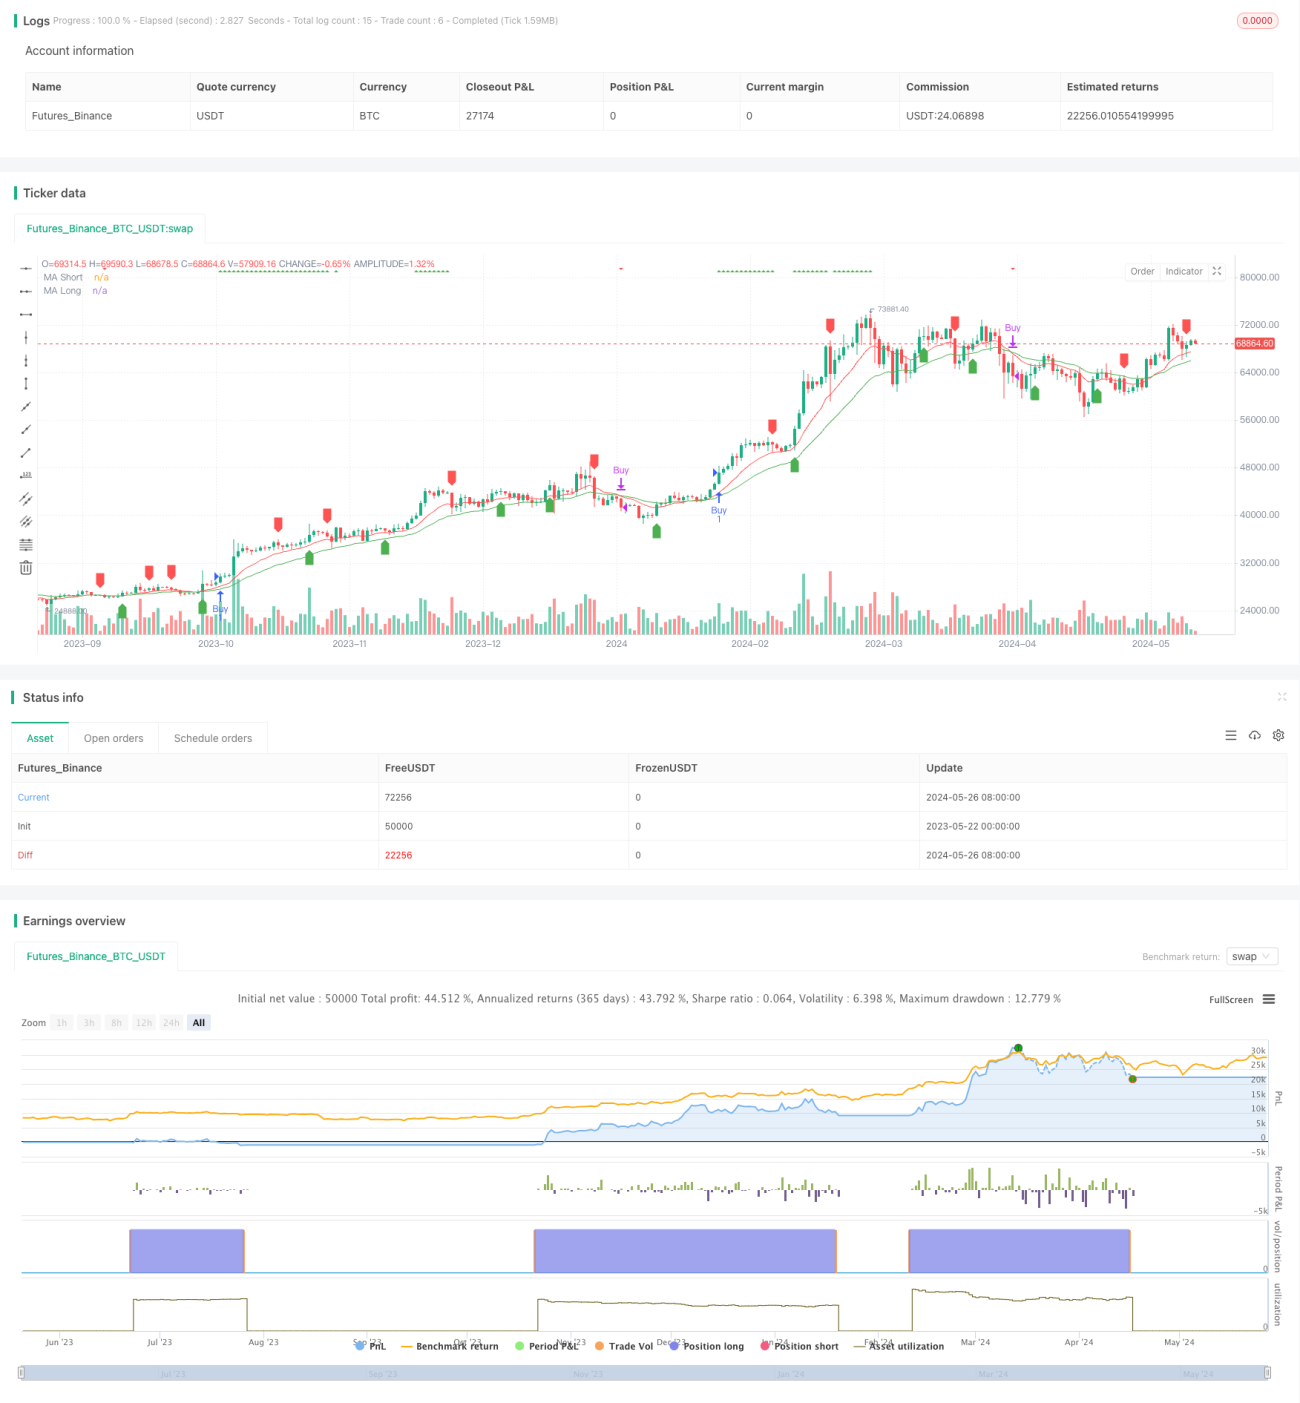
Überblick
Die Strategie kombiniert den RSI mit einem Moving Average (MA) um ein Handelssignal zu erzeugen. Der RSI wird verwendet, um zu entscheiden, ob ein Markt überkauft oder überverkauft ist, und der MA wird verwendet, um die Preisentwicklung zu bestimmen. Es erzeugt ein Kaufsignal, wenn der RSI überkauft ist und der Preis höher ist als der MA.
Strategieprinzip
- Berechnen Sie den RSI-Wert, um zu entscheiden, ob der Markt überkauft ist (<70) oder überverkauft (<30).
- Berechnen Sie die MA für die benutzerdefinierten Zeiten, einschließlich der vier Arten EMA, SMA, HMA und WMA, und entscheiden Sie, ob sie in der Tabelle angezeigt werden, basierend auf den Parameter-Einstellungen.
- Wenn der RSI überkauft ist und der Schlusskurs über dem MA liegt, erzeugt er ein Kaufsignal; wenn der RSI überkauft ist oder der MA einen Dead Fork erzeugt, erzeugt er ein Verkaufssignal.
- Die Einführung des StochRSI-Indikators als Hilfsentscheidung, der StochRSI überkauft ((> 70) oder überverkauft ((< 30) markiert Hinweise auf der Grafik, aber erzeugt kein tatsächliches Handelssignal.
Strategische Vorteile
- Die Kombination der klassischen Indikatoren RSI und MA ermöglicht eine bessere Erfassung von Trends und Überkauf-Überverkauf-Momenten.
- MA-Typen und -parameter sind frei einstellbar, flexibel und an unterschiedliche Markteigenschaften anpassbar.
- Die Einführung des StochRSI als Hilfsmechanismus, um die Handelskontrollen zu verbessern.
- Die Code-Logik ist klar, lesbar, leicht zu verstehen und zweitgenutzt.
Strategisches Risiko
- Der RSI und der MA sind nachlässige Indikatoren, die zu Beginn einer Trendwende möglicherweise mehr irreführende Signale erzeugen.
- Die falsche Einstellung der Parameter kann dazu führen, dass das Signal zu früh oder zu spät gesendet wird, was sich auf das Gesamtergebnis auswirkt.
- Das Fehlen von Stop-Loss- und Positionsmanagement kann zu einem hohen Risiko bei starken Marktschwankungen führen.
Richtung der Strategieoptimierung
- Die Einführung weiterer Vordergrundindikatoren wie der Volatilitätsrate, um eine Trendwende im Voraus zu beurteilen.
- Die Filterung von Kauf- und Verkaufssignalen, wie zum Beispiel die Aufforderung, dass RSI und MA gleichzeitig bestimmte Bedingungen erfüllen, um ein Signal zu erzeugen, um die Signalgenauigkeit zu verbessern.
- Ein Stop-Loss- und Positionsmanagementmodul wurde in die Strategie integriert, um das Risiko für einzelne Geschäfte und das Gesamtrisiko zu kontrollieren.
- Optimierung der Parameter der Strategie, um die optimale Kombination von Parametern zu finden.
- Erwägen Sie, verschiedene Zyklen oder mehrere Sorten hinzuzufügen, um die Verbindung zwischen den Sorten oder Zyklen zu nutzen.
Zusammenfassen
Durch die Kombination von zwei klassischen Indikatoren, RSI und MA, ist es möglich, Trends und Überkauf-Überverkauf-Momente zu erfassen, während die Einführung des StochRSI-Indikators als Hilfsmechanismus verwendet wird. Die Gesamtidee ist einfach und klar. Die Strategie weist jedoch einige Mängel auf, wie z. B. das Fehlen von Risikokontrollmaßnahmen, die Verbesserung der Signalgenauigkeit usw. In Zukunft kann die Strategie durch die Einführung von mehr Indikatoren, Optimierung der Signalregeln und die Aufnahme von Risikokontrollmodulen verbessert werden, um einen stabileren Gewinn zu erzielen.
- 1