Multi-Zeitskalen-SMA-Trendverfolgung und dynamische Stop-Loss-Strategie

SMA Trend
Erstellungsdatum: 2024-06-03 10:57:05 zuletzt geändert: 2024-06-03 10:57:05
Kopie: 3 Klicks: 553
1
konzentrieren Sie sich auf
1617
Anhänger

Multi-Zeitskalen-SMA-Trendverfolgung und dynamische Stop-Loss-Strategie

Überblick

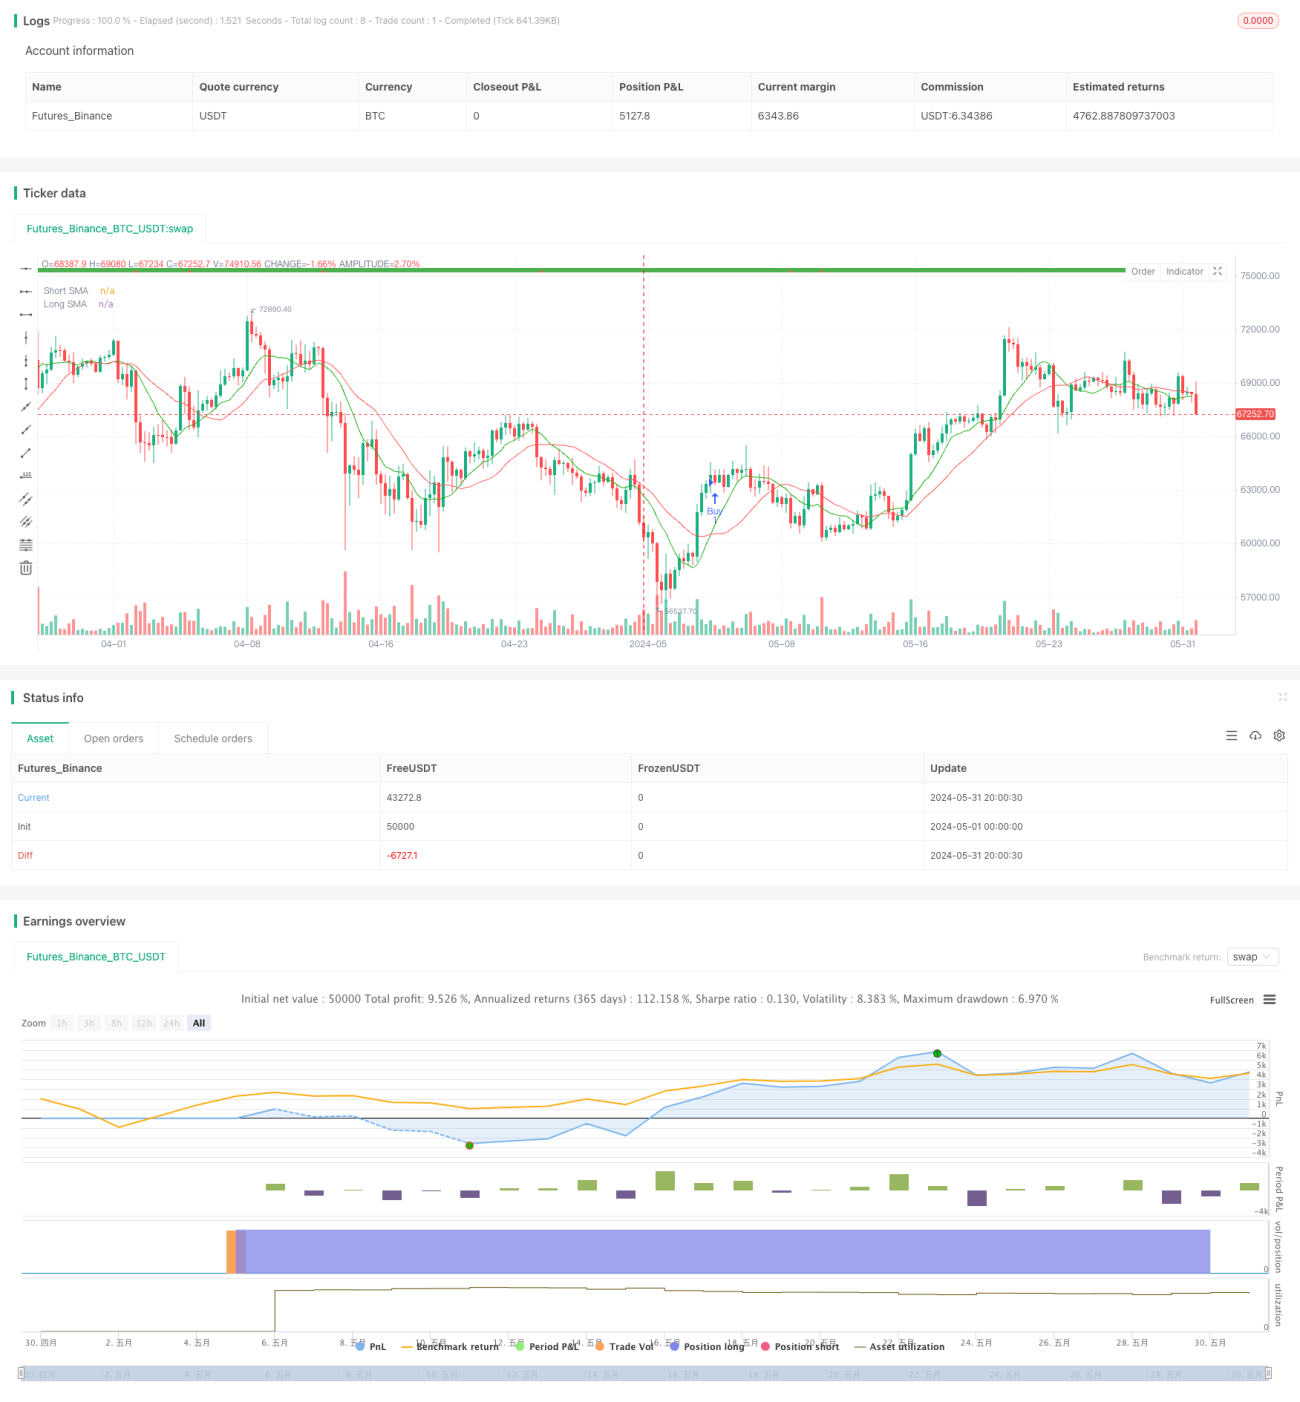
Die Strategie basiert auf einfachen Moving Averages (SMA) auf verschiedenen Zeitskalen, um Markttrends zu erfassen. Sie erzeugt Kauf- und Verkaufssignale durch den Vergleich der relativen Position von kurz- und langfristigen SMAs. Die Strategie verwendet zugleich Trendbestätigungsbedingungen, um falsche Signale zu filtern und die Handelsgenauigkeit zu verbessern.

Strategieprinzip

  1. Berechnung von kurz- und langfristigen SMAs, um die Richtung der Markttrends zu bestimmen.
  2. Wenn ein kurzer SMA einen langen SMA durchläuft, wird ein Kaufsignal erzeugt. Wenn ein kurzer SMA einen langen SMA durchläuft, wird ein Verkaufsignal erzeugt.
  3. Die Trendbestätigungsbedingungen werden verwendet, um falsche Signale zu filtern. Kaufen wird nur ausgeführt, wenn der Haupttrend mehrköpfig ist, und Verkaufen wird nur ausgeführt, wenn der Haupttrend leer ist.
  4. Setzen Sie Stop-and-Loss-Funktionen, um das Handelsrisiko zu kontrollieren. Befreien Sie sich von der Position, wenn der Preis das vorgegebene Stop- oder Stop-Loss-Niveau erreicht.
  5. Dynamische Anpassung der Positionen an die Trendbestätigung. Befreien Sie sich von Verlusten, die durch eine Trendwende verursacht werden, wenn sich der Haupttrend ändert.

Strategische Vorteile

  1. Trend-Tracking: Die Strategie basiert auf SMAs auf verschiedenen Zeitskalen und kann die wichtigsten Trends des Marktes effektiv erfassen und sich an unterschiedliche Marktbedingungen anpassen.
  2. Trendbestätigung: Durch die Einführung von Trendbestätigungsbedingungen werden Falschsignale gefiltert, die Zuverlässigkeit von Handelssignalen erhöht und ungültige Geschäfte reduziert.
  3. Risikomanagement: Eingebettete Stop-Loss-Funktionen, die helfen, die Risiken des Handels zu kontrollieren und die Sicherheit der Gelder der Anleger zu schützen.
  4. Dynamische Anpassung: Dynamische Anpassung der Positionen nach der Bestätigung des Trends, um rechtzeitig auf Marktveränderungen zu reagieren und die Verluste durch eine Trendwende zu verringern.

Strategisches Risiko

  1. Parameteroptimierungsrisiken: Die Performance der Strategie hängt von der Wahl der Parameter für den SMA-Zyklus und die Stop-Loss-Gleichgewichtsparameter ab. Die falsche Einstellung der Parameter kann zu einer schlechten Strategieeffektivität führen.
  2. Schwankungsrisiko: In einem schwankenden Marktumfeld können häufige Handelssignale zu Überhändlungen führen, die die Kosten und das Risiko für den Handel erhöhen.
  3. Das Risiko eines unerwarteten Ereignisses: Im Falle eines unerwarteten Ereignisses, bei dem die Märkte stark schwanken können, kann die Strategie nicht rechtzeitig eingesetzt werden, was zu größeren Verlusten führt.

Richtung der Strategieoptimierung

  1. Einführung von mehr technischen Indikatoren: In Kombination mit anderen technischen Indikatoren wie MACD, RSI und anderen, verbessert die Genauigkeit und Stabilität der Trendbeurteilung.
  2. Optimierung der Parameterwahl: Suche nach der optimalen SMA-Periode durch historische Datenrückverfolgung und Parameteroptimierung. Stop-Loss-Equilibrium-Parameterkombination, Verbesserung der Strategieperformance.
  3. Verbesserung des Risikomanagements: Die Einführung von fortgeschritteneren Risikomanagementtechniken wie Dynamic Stop Losses, Positionsmanagement usw. führt zu einer weiteren Kontrolle der Risikothek.
  4. Anpassung an unterschiedliche Marktbedingungen: Strategieparameter werden dynamisch angepasst, um die Strategie an unterschiedliche Marktbedingungen anzupassen, je nach Marktvolatilität und Trendstärke.

Zusammenfassen

Die Multi-Zeitskala SMA Trend Tracking und Dynamische Stop-Strategie nutzt die unterschiedlichen Zeitskalen der SMA Markttrends zu erfassen, durch Trend Bestätigung Bedingungen zu filtern falsche Signale, während die Einstellung Stop-Loss und Dynamische Positionsanpassung Funktion, die Ziele der Trend-Tracking und Risikomanagement erreicht. Obwohl die Strategie hat einige Vorteile, aber immer noch mit Parameter Optimierung, Schaukel-Markt und Unvorhergesehene Risiken.

Strategiequellcode
/*backtest
start: 2024-05-01 00:00:00
end: 2024-05-31 23:59:59
period: 6h
basePeriod: 15m
exchanges: [{"eid":"Futures_Binance","currency":"BTC_USDT"}]
*/

//@version=5
strategy("market slayer v3", overlay=true)

// Input parameters
showConfirmationTrend = input(title='Show Trend', defval=true)
confirmationTrendTimeframe = input.timeframe(title='Main Trend', defval='240')
confirmationTrendValue = input(title='Main Trend Value', defval=2)
showConfirmationBars = input(title='Show Confirmation Bars', defval=true)
topCbarValue = input(title='Top Confirmation Value', defval=60)
short_length = input.int(10, minval=1, title="Short SMA Length")
long_length = input.int(20, minval=1, title="Long SMA Length")
takeProfitEnabled = input(title="Take Profit Enabled", defval=false)
takeProfitValue = input.float(title="Take Profit (points)", defval=20, minval=1)
stopLossEnabled = input(title="Stop Loss Enabled", defval=false)
stopLossValue = input.float(title="Stop Loss (points)", defval=50, minval=1)

// Calculate SMAs
short_sma = ta.sma(close, short_length)
long_sma = ta.sma(close, long_length)

// Generate buy and sell signals based on SMAs
buy_signal = ta.crossover(short_sma, long_sma)
sell_signal = ta.crossunder(short_sma, long_sma)

// Plot SMAs
plot(short_sma, color=color.rgb(24, 170, 11), title="Short SMA")
plot(long_sma, color=color.red, title="Long SMA")

// Confirmation Bars
f_confirmationBarBullish(cbValue) =>
    cBarClose = close
    slowConfirmationBarSmaHigh = ta.sma(high, cbValue)
    slowConfirmationBarSmaLow = ta.sma(low, cbValue)
    slowConfirmationBarHlv = int(na)
    slowConfirmationBarHlv := cBarClose > slowConfirmationBarSmaHigh ? 1 : cBarClose < slowConfirmationBarSmaLow ? -1 : slowConfirmationBarHlv[1]
    slowConfirmationBarSslDown = slowConfirmationBarHlv < 0 ? slowConfirmationBarSmaHigh : slowConfirmationBarSmaLow
    slowConfirmationBarSslUp = slowConfirmationBarHlv < 0 ? slowConfirmationBarSmaLow : slowConfirmationBarSmaHigh
    slowConfirmationBarSslUp > slowConfirmationBarSslDown

fastConfirmationBarBullish = f_confirmationBarBullish(topCbarValue)
fastConfirmationBarBearish = not fastConfirmationBarBullish
fastConfirmationBarClr = fastConfirmationBarBullish ? color.green : color.red

fastConfirmationChangeBullish = fastConfirmationBarBullish and fastConfirmationBarBearish[1]
fastConfirmationChangeBearish = fastConfirmationBarBearish and fastConfirmationBarBullish[1]

confirmationTrendBullish = request.security(syminfo.tickerid, confirmationTrendTimeframe, f_confirmationBarBullish(confirmationTrendValue), lookahead=barmerge.lookahead_on)
confirmationTrendBearish = not confirmationTrendBullish
confirmationTrendClr = confirmationTrendBullish ? color.green : color.red

// Plot trend labels
plotshape(showConfirmationTrend, style=shape.square, location=location.top, color=confirmationTrendClr, title='Trend Confirmation Bars')
plotshape(showConfirmationBars and (fastConfirmationChangeBullish or fastConfirmationChangeBearish), style=shape.triangleup, location=location.top, color=fastConfirmationChangeBullish ? color.green : color.red, title='Fast Confirmation Bars')
plotshape(showConfirmationBars and buy_signal and confirmationTrendBullish, style=shape.triangleup, location=location.top, color=color.green, title='Buy Signal')
plotshape(showConfirmationBars and sell_signal and confirmationTrendBearish, style=shape.triangledown, location=location.top, color=color.red, title='Sell Signal')

// Generate trade signals
buy_condition = buy_signal and confirmationTrendBullish and not (strategy.opentrades > 0)
sell_condition = sell_signal and confirmationTrendBearish and not (strategy.opentrades > 0)

strategy.entry("Buy", strategy.long, when=buy_condition, comment ="BUY CALLS")
strategy.entry("Sell", strategy.short, when=sell_condition, comment ="BUY PUTS")

// Take Profit
if (takeProfitEnabled)
    strategy.exit("Take Profit Buy", from_entry="Buy", profit=takeProfitValue)
    strategy.exit("Take Profit Sell", from_entry="Sell", profit=takeProfitValue)

// Stop Loss
if (stopLossEnabled)
    strategy.exit("Stop Loss Buy", from_entry="Buy", loss=stopLossValue)
    strategy.exit("Stop Loss Sell", from_entry="Sell", loss=stopLossValue)

// Close trades based on trend confirmation bars
if strategy.opentrades > 0
    if strategy.position_size > 0
        if not confirmationTrendBullish
            strategy.close("Buy", comment ="CLOSE CALLS")
    else
        if not confirmationTrendBearish
            strategy.close("Sell", comment ="CLOSE PUTS")

// Define alert conditions as booleans
buy_open_alert = buy_condition
sell_open_alert = sell_condition
buy_closed_alert = strategy.opentrades < 0
sell_closed_alert = strategy.opentrades > 0

// Alerts
alertcondition(buy_open_alert, title='Buy calls', message='Buy calls Opened')
alertcondition(sell_open_alert, title='buy puts', message='buy Puts Opened')
alertcondition(buy_closed_alert, title='exit calls', message='exit calls ')
alertcondition(sell_closed_alert, title='exit puts', message='exit puts Closed')