EMA- und RSI-Crossover-Strategie

1
Follow
1781
Followers
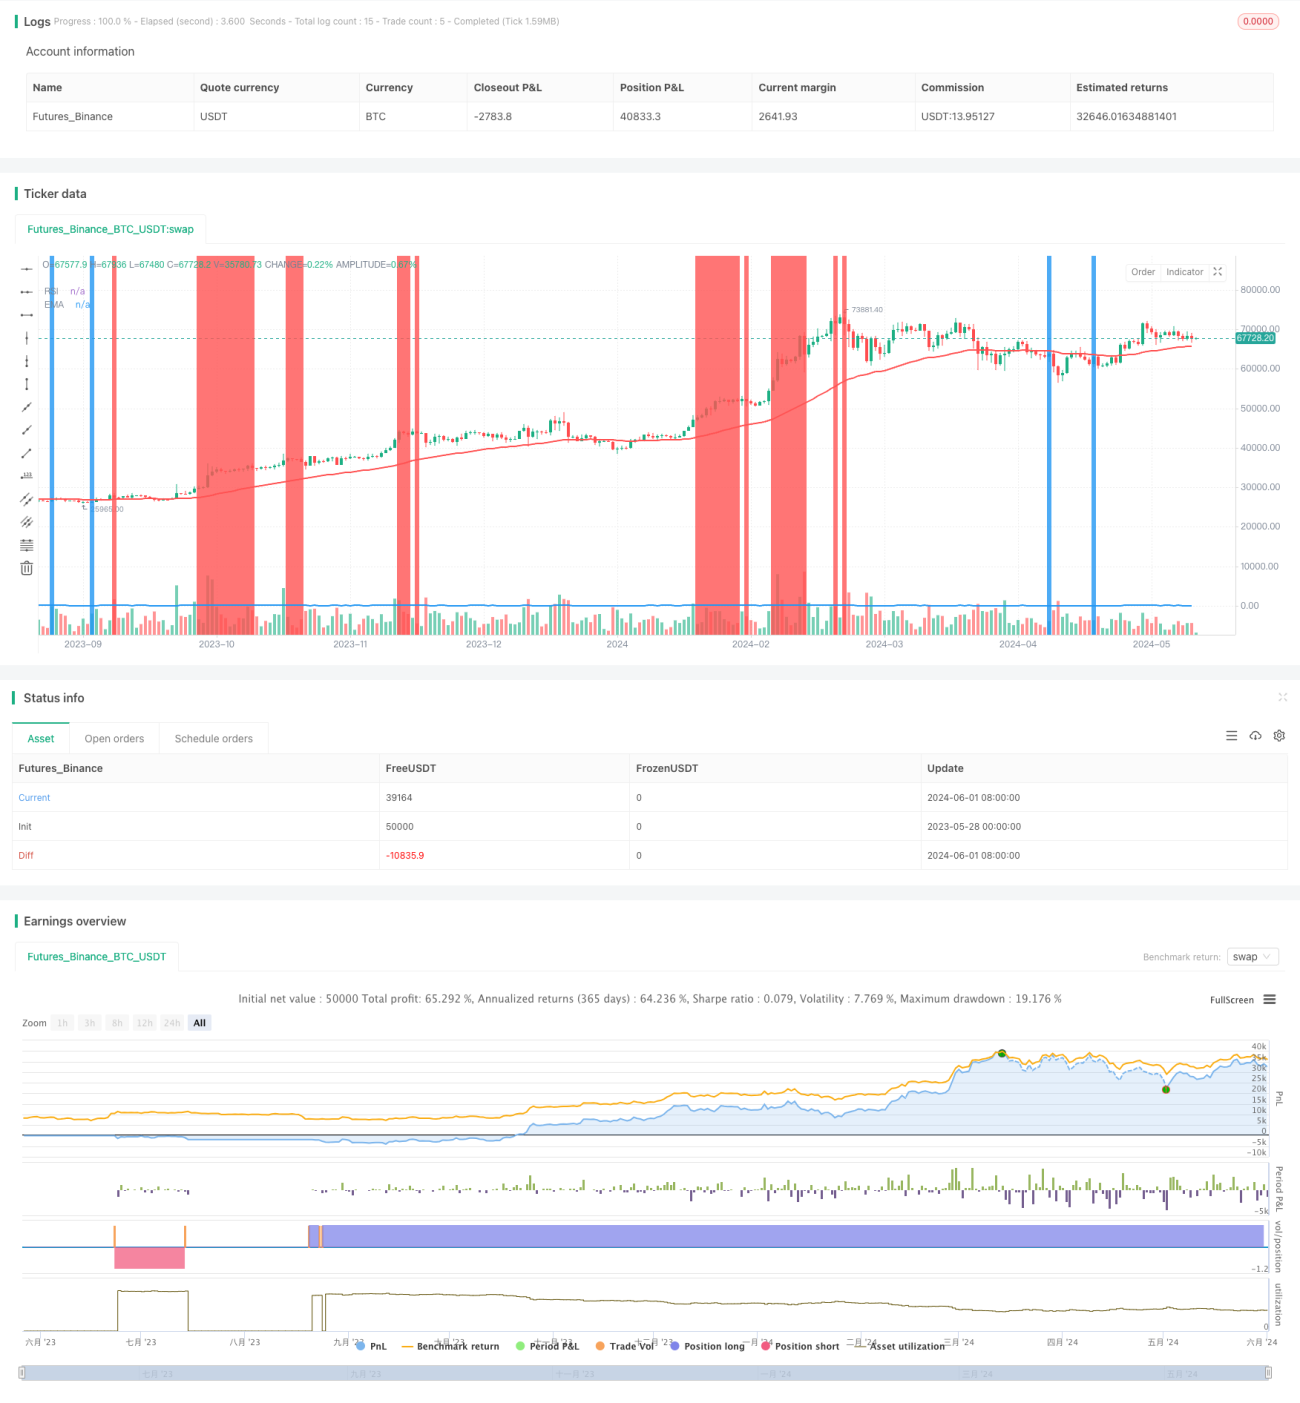
Überblick
Die EMA-RSI-Kreuzungs-Strategie verwendet die Kombination von Index-Moving Averages (EMA) und relativ starken RSI-Index (RSI) zur Identifizierung potenzieller Kauf- oder Verkaufssignale. Wenn die EMA und der RSI sich kreuzen, ist dies ein Hinweis darauf, dass sich die Marktbewegung verändern kann.
Strategieprinzip
- Berechnen Sie den RSI-Wert für die angegebene Periode und zeichnen Sie ihn in einer Grafik dar.
- Berechnen Sie die EMA-Werte für die angegebene Periode und zeichnen Sie sie in einer Tabelle ab.
- Wenn der Preis unter der EMA liegt und der RSI kleiner als 20 ist, gilt dies als Kaufsignal. Wenn der Preis über der EMA liegt und der RSI größer als 80 ist, gilt dies als Verkaufsignal.
- Wenn ein Kaufsignal auftritt und der aktuelle Kursschlusskurs höher ist als der vorherige Kurs, wird eine Position überschritten. Wenn ein Verkaufssignal auftritt und der aktuelle Kursschlusskurs niedriger ist als der vorherige Kurs, wird eine Position aufgelöst.
- Stop- und Stop-Price-Berechnung unter Verwendung der durchschnittlichen realen Schwankungsbreite (ATR). Stop-Price-Berechnung abzüglich des Eröffnungspreises (ATR + Umlauflänge) und Stop-Price-Berechnung abzüglich des Eröffnungspreises (ATR + Umlauflänge).*(ATR+Länge der Kabelobjekte))
Strategische Vorteile
- In Kombination mit dem Trend-Tracking-Indikator EMA und dem Dynamik-Indikator RSI ist es möglich, die Marktentwicklung umfassender zu beurteilen.
- Es ist wichtig, dass die Trend-Signal-Systeme in den Anfangsstadien der Trendentwicklung eingesetzt werden, um die Chancen für einen Trend so früh wie möglich zu nutzen.
- Mit dem ATR kann man die Stop-Loss- und Stopp-Distanz dynamisch anpassen, um besser auf Marktschwankungen reagieren zu können.
- Gleichzeitig wird die Position der Preise und der Indikatoren sowie die Form der Kabel berücksichtigt, was die Zuverlässigkeit des Signals erhöht.
Strategisches Risiko
- Die EMA und der RSI zeigen eine gewisse Verzögerung, wobei ein Kreuzung der Indikatoren möglich ist, ohne dass der Preis sofort umgekehrt wird, was zu falschen Signalen führt.
- Der RSI erzeugt häufige Kreuzungen in schwankenden Märkten, was zu Überhändlungen führen kann.
- Der festgelegte RSI-Termine kann nicht für alle Marktsituationen gelten und muss je nach Markteigenschaften angepasst werden.
- Die Strategie hängt stark von der Berechnung von Stop-Loss- und Stop-Stopp-ATR ab, wobei die ATR-Werte durch plötzliche starke Preisschwankungen verfälscht werden können.
Richtung der Strategieoptimierung
- Optimierung der EMA- und RSI-Parameter, um die beste Kombination für den aktuellen Markt zu finden.
- In einem wackligen Markt werden weitere Filterbedingungen wie Handelsvolumenänderungen, Volatilität usw. hinzugefügt, um häufige falsche Signale zu filtern.
- Der RSI wird von oben nach unten angepasst, um sich an unterschiedliche Marktbedingungen anzupassen.
- Verwenden Sie verschiedene Stop-and-Stop-Methoden, wie Stop-Stop-Stopps, die auf Widerstandspositionen basieren, oder mobile Stop-Stopps in Kombination mit Trendrichtung, um die Risikokontrolle zu verbessern.
- Ein Positionsmanagementmodul, das die Positionsgröße für jeden Handel dynamisch an die Marktschwankungen und die Risikostandards des Kontos anpasst.
Zusammenfassen
Die EMA-RSI-Kreuzstrategie ist eine einfache und benutzerfreundliche Trendverfolgungsstrategie, die die Richtung des Marktes durch die Kombination von Trends und Dynamik in zwei Dimensionen vergleichsweise umfassend beurteilt. Gleichzeitig verwendet die Strategie einige Filterbedingungen und dynamische Stop-Loss-Stopp-Methoden, um die Signalqualität und die Risikokontrolle zu verbessern.
Source
Pine
Strategy parameters
Related strategies
Comment
All comments (0)
No data
- 1