Supertrend- und EMA-Kombinationsstrategie

Überblick
Eine Supertrend-EMA-Kombination ist eine Handelsstrategie, bei der der Supertrend-Indikator mit mehreren EMA-Indikatoren kombiniert wird. Die Strategie nutzt die Supertrend-Indikatoren, um die Richtung des aktuellen Markttrends zu bestimmen, und verwendet die EMA-Indikatoren verschiedener Zyklen als Trigger für die Kauf- und Verkaufssignale. Ein Kaufsignal wird erzeugt, wenn der kurzfristige EMA mit dem mittleren EMA verzweigt ist und der Supertrend-Indikator einen Aufwärtstrend zeigt.
Strategieprinzip
Der Supertrend- und EMA-Kombinationsstrategiekernel nutzt die Eigenschaften des Supertrend- und EMA-Indikators, um Trendänderungen und Preisschwankungen auf dem Markt zu erfassen. Der Supertrend-Indikator beurteilt die Richtung des aktuellen Markttrends, indem er den aktuellen Schlusskurs mit dem Auf- und Ablauf des vorherigen Zyklus vergleicht. Wenn der Schlusskurs über den Schlusskurs fällt, zeigt der Markt einen Aufwärtstrend an. Wenn der Schlusskurs über den Schlusskurs fällt, zeigt der Markt einen Abwärtstrend an.
Strategische Vorteile
- Die Supertrend-Indikatoren können Trendänderungen in den Märkten effektiv erfassen und helfen, die Strategie zu handeln, die den Markttrends entspricht.
- Mehrfache EMA-Bestätigung: Die Verwendung von EMA-Indikatoren mit unterschiedlichen Perioden als Auslöser für Kauf- und Verkaufssignale kann die Signalzuverlässigkeit erhöhen und das Auftreten von Falschsignalen verringern.
- Risikokontrolle: Die Trends des Supertrend-Indikators können den Handel in einer abweichenden Situation verhindern und das Risiko senken.
- Anpassungsfähigkeit: Die Strategie kann auf verschiedene Märkte und Sorten angewendet werden und hat eine gute Anpassungsfähigkeit und Flexibilität.
Strategisches Risiko
- Parameteroptimierungsrisiken: Die Parameter-Einstellungen für Supertrend- und EMA-Indikatoren haben einen großen Einfluss auf die Strategie-Performance, und unangemessene Parameter können dazu führen, dass die Strategie ausfällt.
- Risiken von Marktschwankungen: In Zeiten starker Marktschwankungen können sich kurzfristige EMAs häufig mit mittleren EMAs kreuzen, was zu mehreren Falschsignalen führt.
- Trendwechselrisiko: Wenn sich ein Marktwechsel ereignet, kann der Supertrend-Indikator zurückbleiben, was zu einem Verlust der Strategie am Anfang des Trendwechsels führt.
Richtung der Strategieoptimierung
- Optimierung der Parameter: Durch die Optimierung der Multiplikation der Supertrend-Indikatoren und der Periodizität der EMA-Indikatoren wird die optimale Kombination von Parametern gefunden, um die Stabilität und Profitabilität der Strategie zu verbessern.
- Signalfilterung: Nach der EMA-Kreuzung kann das Signal in Kombination mit anderen technischen Indikatoren (wie RSI, MACD usw.) zweimal bestätigt werden, um die Zuverlässigkeit des Signals zu erhöhen.
- Stop-Loss-Stopp: Einführung eines vernünftigen Stop-Loss-Stopp-Mechanismus, um das Risiko für einzelne Geschäfte zu kontrollieren und die Risiko-Gewinn-Ratio der Strategie zu erhöhen.
- Multi-Variante-Multi-Zyklus: Die Strategie wird auf verschiedene Sorten und Zyklen angewendet, um das Gesamtrisiko durch diversifizierte Investitionen zu reduzieren.
Zusammenfassen
Die Strategie nutzt die Supertrend-Indikatoren, um die Markttrends zu beurteilen, und erzeugt gleichzeitig Kauf- und Verkaufssignale durch die Kreuzung der EMA-Indikatoren. Die Strategie hat die Vorteile, dass sie eine starke Trendverfolgung, eine zuverlässige Signalbestätigung und eine große Anpassungsfähigkeit hat. Die Strategie ist jedoch auch mit Risiken wie Parameteroptimierung, Marktfluktuation und Trendwechsel konfrontiert.
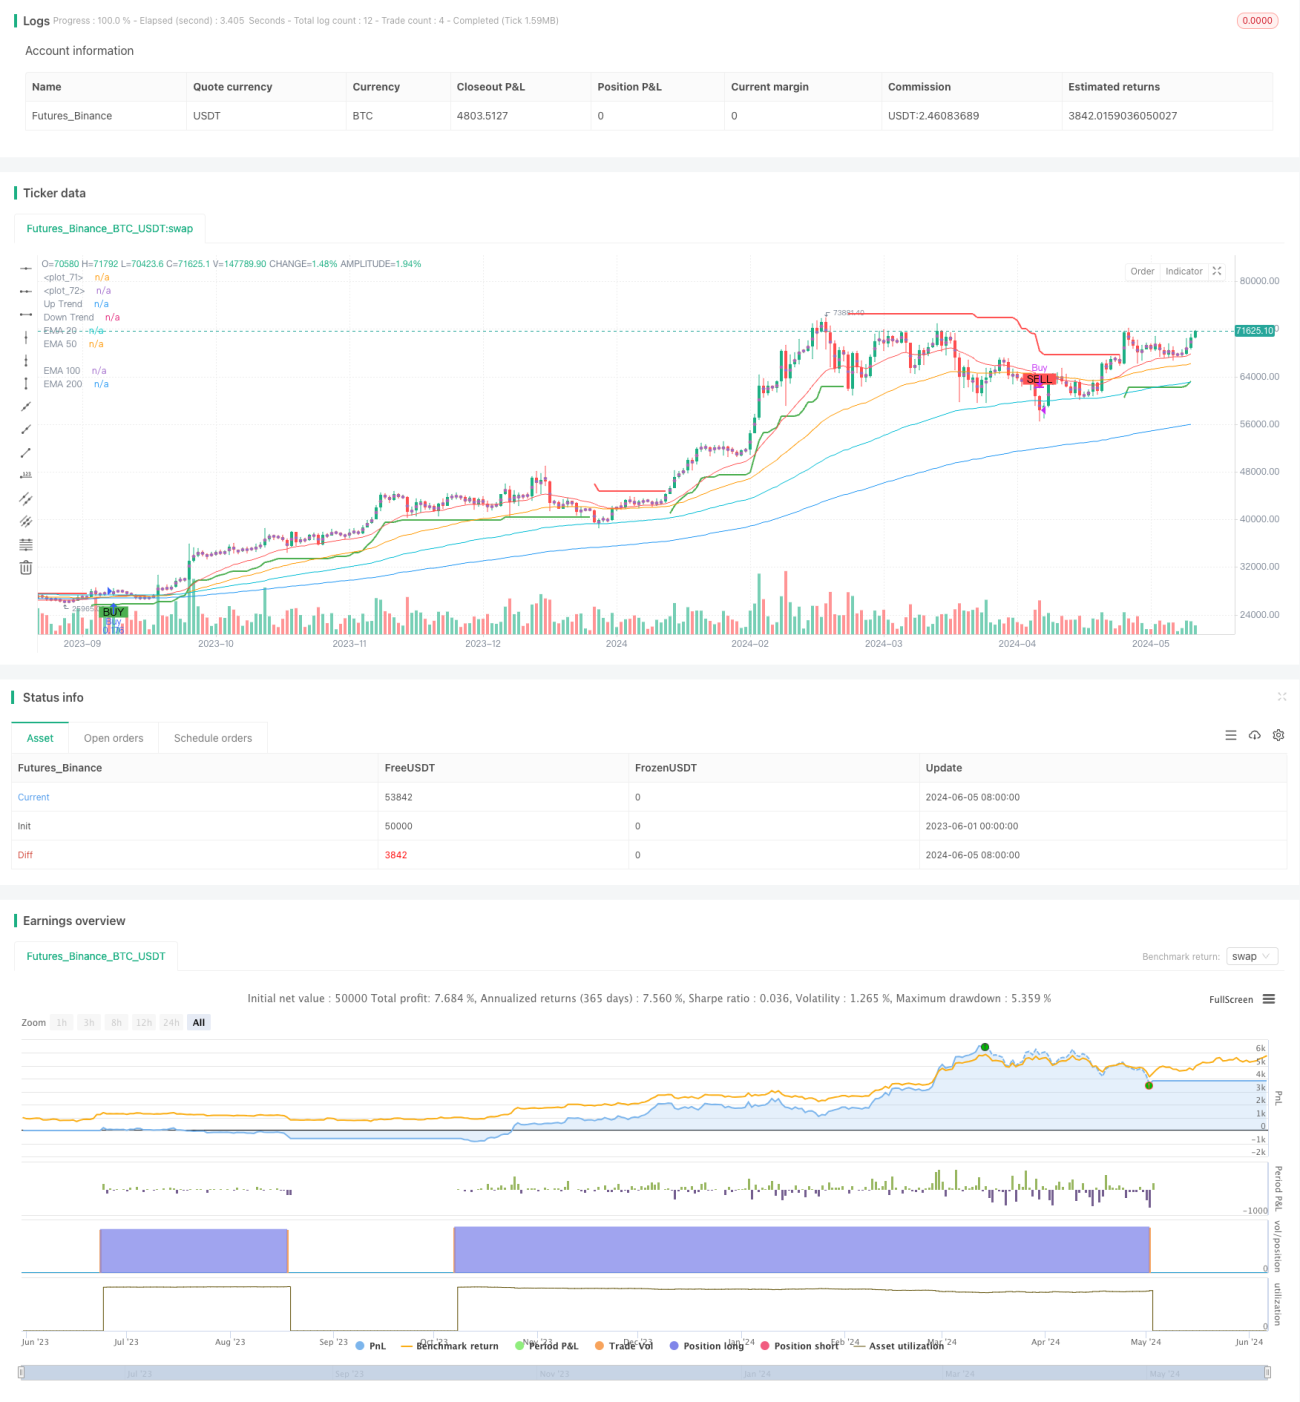
/*backtest
start: 2023-06-01 00:00:00
end: 2024-06-06 00:00:00
period: 1d
basePeriod: 1h
exchanges: [{"eid":"Futures_Binance","currency":"BTC_USDT"}]
*/

//@version=4
strategy("Supertrend EMA Strategy", overlay=true, default_qty_type=strategy.percent_of_equity, default_qty_value=10)

// Supertrend Parameters- 1