G Trend EMA ATR Intelligente Handelsstrategie

Überblick
Die Strategie nutzt G-Kanal-Indikatoren, um die Richtung des Markttrends zu erkennen, und kombiniert EMA und ATR-Indikatoren, um die Ein- und Ausstiegspunkte zu optimieren. Die Hauptidee der Strategie lautet: Wenn der Preis den G-Kanal überschreitet und unterhalb der EMA mehr macht, wird der G-Kanal unterhalb der G-Kanal überschritten und oberhalb der EMA leer. Gleichzeitig wird der ATR verwendet, um einen dynamischen Stop-and-Stop-Bereich einzurichten.
Strategieprinzip
- Berechnung der Auf- und Abspannung des G-Kanals: Berechnung der Auf- und Abspannung des G-Kanals unter Verwendung des aktuellen Schlusskurses und des vorherigen Höchst-Mindestpreises.
- Beurteilung der Richtung des Trends: Beurteilung des Hohlraumtrends durch die Beobachtung der Beziehung zwischen dem Preis und dem Auf- und Abstieg des G-Kanals.
- Berechnung der EMA: Berechnung des EMA-Wertes für die angegebene Periode.
- Berechnung des ATR: Berechnung des ATR für die angegebene Periode.
- Beurteilung der Kauf- und Verkaufskonditionen: Wenn der Preis den G-Kanal überschreitet und unterhalb der EMA ist, wird ein Plus ausgelöst, wenn er den G-Kanal überschreitet und unterhalb der EMA ist, wird ein Minus ausgelöst.
- Die Stop-Loss-Einstellung: Die Stop-Loss-Einstellung ist der Eröffnungspreis - 2-fache ATR, die Stop-Loss-Einstellung ist der Eröffnungspreis + 4-fache ATR (Mehrköpfe); die Stop-Loss-Einstellung ist der Eröffnungspreis + 2-fache ATR, die Stop-Loss-Einstellung ist der Eröffnungspreis - 4-fache ATR (Leerköpfe).
- Strategie-Trigger: Erledigt die entsprechende Positionseröffnung, wenn die Kauf- und Verkaufskonditionen erfüllt sind, und setzt die entsprechende Stop-Loss-Sperre ein.
Strategische Vorteile
- Trend-Tracking: Strategien zur effektiven Erfassung von Markttrends im Rahmen von Trends.
- Dynamische Stop-Loss-Positions: Die ATR kann die Stop-Loss-Position dynamisch anpassen, um besser auf Marktschwankungen eingehen zu können.
- Risikokontrolle: Die Stop-Loss-Bedingung ist auf das 2-fache des ATR festgelegt, um das Risiko für jeden Handel streng zu kontrollieren.
- Einfach zu bedienen: Die Strategie ist klar und logisch und für die meisten Anleger geeignet.
Strategisches Risiko
- In einem wackligen Markt können häufige Handelssignale zu Verlusten führen.
- Parameteroptimierung: Unterschiedliche Sorten und Zyklen können unterschiedliche Parameter benötigen, was zu einem Risiko führt.
- Black Swan: Im Extremfall kann es zu starken Preisschwankungen kommen, sodass die Stop-Loss-Regelung nicht wirksam ausgeführt werden kann.
Richtung der Strategieoptimierung
- Trendfilter: Erhöhen Sie Trendfilterbedingungen wie MA-Kreuzungen, DMI, etc. und reduzieren Sie den Handel in schwankenden Zeiten.
- Parameteroptimierung: Parameteroptimierung für verschiedene Sorten und Perioden, um die optimale Parameterkombination zu finden.
- Positionsmanagement: Anpassung der Positionen an die dynamischen Marktschwankungen, um die Kapitalnutzung zu erhöhen.
- Kombinationsstrategie: Kombination mit anderen effektiven Strategien zur Steigerung der Stabilität.
Zusammenfassen
Die Strategie baut ein einfaches und effektives Trend-Tracking-Handelssystem mit G-Kanal, EMA, ATR und anderen Indikatoren auf. Sie kann in Trendbewegungen gute Ergebnisse erzielen, aber in Schokbewegungen funktioniert sie im Allgemeinen. Anschließend kann die Strategie in Bezug auf Trendfilter, Parameteroptimierung, Positionsmanagement und Kombinationsstrategien optimiert werden, um die Stabilität und Profitabilität der Strategie weiter zu verbessern.
/*backtest
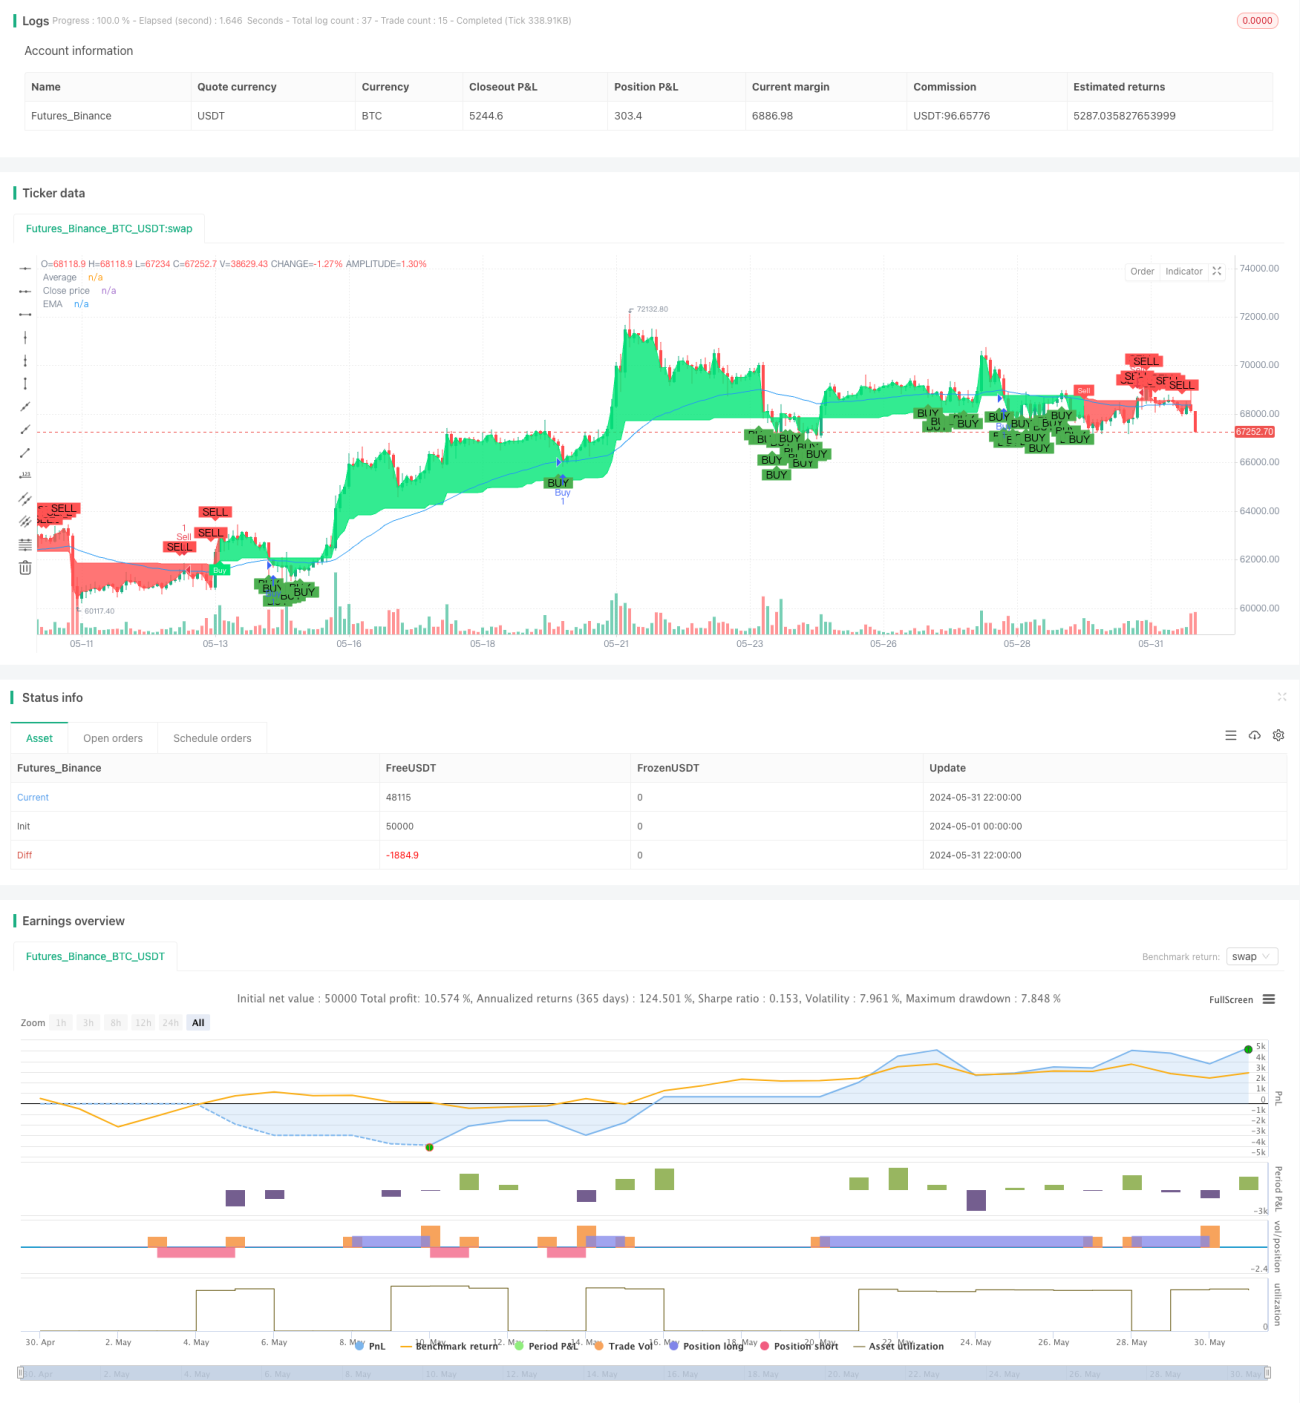
start: 2024-05-01 00:00:00
end: 2024-05-31 23:59:59
period: 2h
basePeriod: 15m
exchanges: [{"eid":"Futures_Binance","currency":"BTC_USDT"}]
*/
//@version=4
// Full credit to AlexGrover: https://www.tradingview.com/script/fIvlS64B-G-Channels-Efficient-Calculation-Of-Upper-Lower-Extremities/
strategy ("G-Channel Trend Detection with EMA Strategy and ATR", shorttitle="G-Trend EMA ATR Strategy", overlay=true)
- 1