Erweiterte Einstiegsbedingungsstrategie basierend auf gleitendem Durchschnitt, Unterstützungswiderstand und Volumen

Überblick
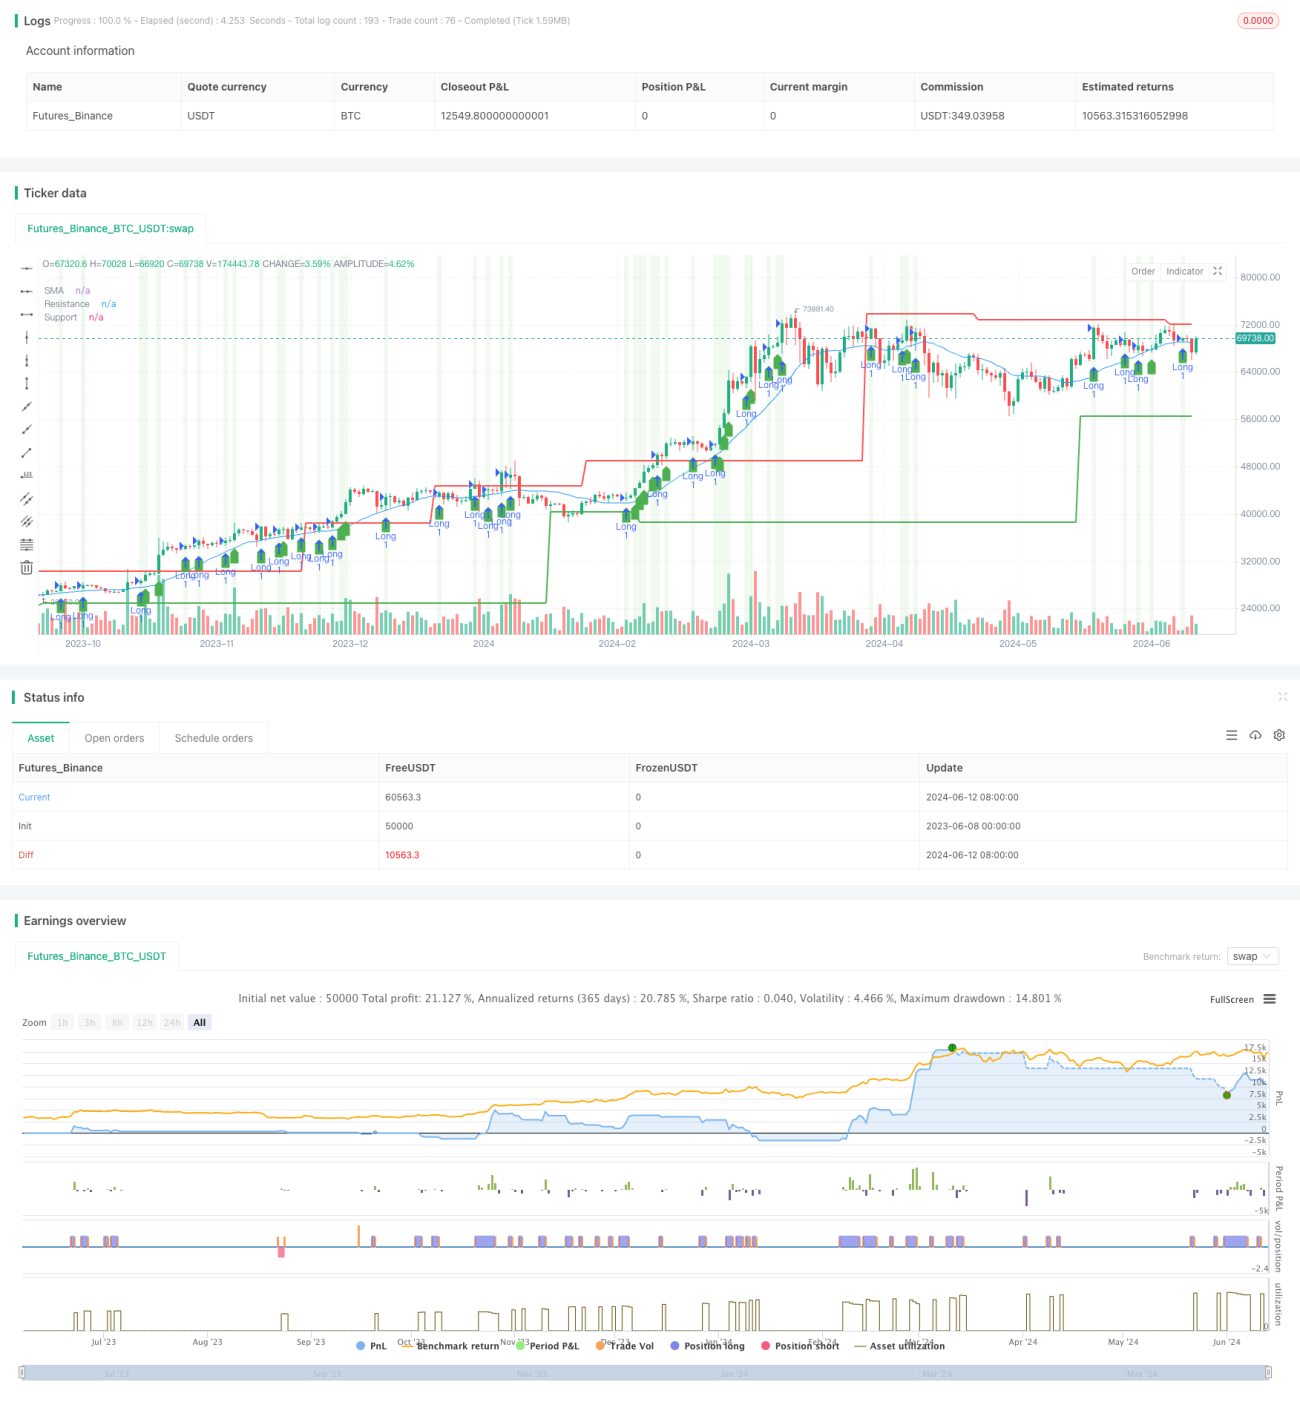
Die Strategie kombiniert die drei technischen Indikatoren eines einfachen Moving Averages (SMA), eines unterstützenden Widerstands und einer Erhöhung des Handelsvolumens, um eine umfassende Handelsstrategie zu erstellen. Die Hauptidee der Strategie besteht darin, bei einem Preisbruch über die SMA-Mittellinie, einem unterstützenden Widerstand und einer erhöhten Handelsmenge zu handeln, während die Stop-Loss-Bedingungen zur Risikokontrolle festgelegt werden.
Strategieprinzip
- Berechnung der SMA-Mittellinie, der Unterstützungs- und der Widerstandsposition für die angegebene Periode.
- Der aktuelle Umsatz hat sich im Vergleich zum Vorjahr erhöht.
- Mehrköpfige Einstiegsbedingungen: Der aktuelle Schlusskurs ist größer als der Schlusskurs der vorherigen Periode und größer als die SMA-Mittellinie und die Unterstützung, während der Preis von der Resistance entfernt ist und mit dem Handelsvolumen zunimmt.
- Leerlauf-Eintrittsbedingungen: Der aktuelle Schlusskurs ist kleiner als der Schlusskurs der vorherigen Periode und kleiner als die SMA-Mittellinie und -Unterstützung, während der Preis von der Resistance entfernt ist und mit dem Handelsvolumen zunimmt.
- Stop-Loss-Bedingungen: Mehrköpfige Stop-Loss-Preise multipliziert mit dem Einstiegspreis (<= 1- Stop-Loss-Prozentsatz) und Leerköpfige Stop-Loss-Preise multipliziert mit dem Einstiegspreis (<= 1 + Stop-Loss-Prozentsatz).
Analyse der Stärken
- In Kombination mit mehreren technischen Indikatoren erhöht sich die Zuverlässigkeit und Stabilität der Strategie.
- Der Preis wird die SMA-Mittellinie und die Resistenzstütze durchbrechen, um die Trendchancen besser zu erfassen.
- Die Einführung von Volumenindikatoren, die sicherstellen, dass Preisbruche mit ausreichender Marktbeteiligung einhergehen, erhöht die Effektivität der Signale.
- Die Einrichtung von Stop-Loss-Bedingungen, die das Handelsrisiko effektiv kontrollieren.
Risikoanalyse
- Die Berechnung der Resistenzstütze basiert auf historischen Daten und kann bei starken Marktschwankungen an Effektivität verlieren.
- Die Handelsvolumenindikatoren können abnormal schwanken, was zu falschen Signalen führt.
- Die Einstellung von Stop-Loss-Bedingungen kann den Verlust in extremen Marktsituationen nicht vollständig verhindern.
Optimierungsrichtung
- Erwägen Sie die Einführung anderer technischer Indikatoren, wie der Relative Strength Index (RSI) oder der Moving Average Convergence Spread (MACD), um die Zuverlässigkeit des Handelssignals weiter zu überprüfen.
- Optimierung der Berechnungsmethoden für die Unterstützung von Widerstandspunkten, z. B. durch ein dynamischeres Verfahren zur Anpassung an unterschiedliche Marktbedingungen.
- Die Handelsvolumen-Indikatoren werden glatter gehandhabt, um die Auswirkungen von außergewöhnlichen Schwankungen auf die Strategie zu verringern.
- Einstellungen zur Optimierung der Stop-Loss-Bedingungen, wie beispielsweise die Verwendung von mobilen Stop-Loss-Bedingungen oder die dynamische Anpassung des Stop-Loss-Prozentsatzes an die Marktschwankungen.
Zusammenfassen
Die Strategie ist in der Lage, Trendchancen zu ergreifen und gleichzeitig das Handelsrisiko zu kontrollieren. Die Strategie hat jedoch auch eine gewisse Einschränkung. Die Strategie kann in Zukunft verbessert werden, um ihre Stabilität und Profitabilität zu verbessern, indem andere technische Indikatoren eingeführt werden, die Berechnung der Resistenz der Unterstützung optimiert wird, die Handelsmengen-Indikatoren geglättet werden und die Bedingungen für die Stop-Loss-Optimierung verbessert werden.
- 1