EMA100 und NUPL relative nicht realisierte Gewinne quantitative Handelsstrategie

Überblick
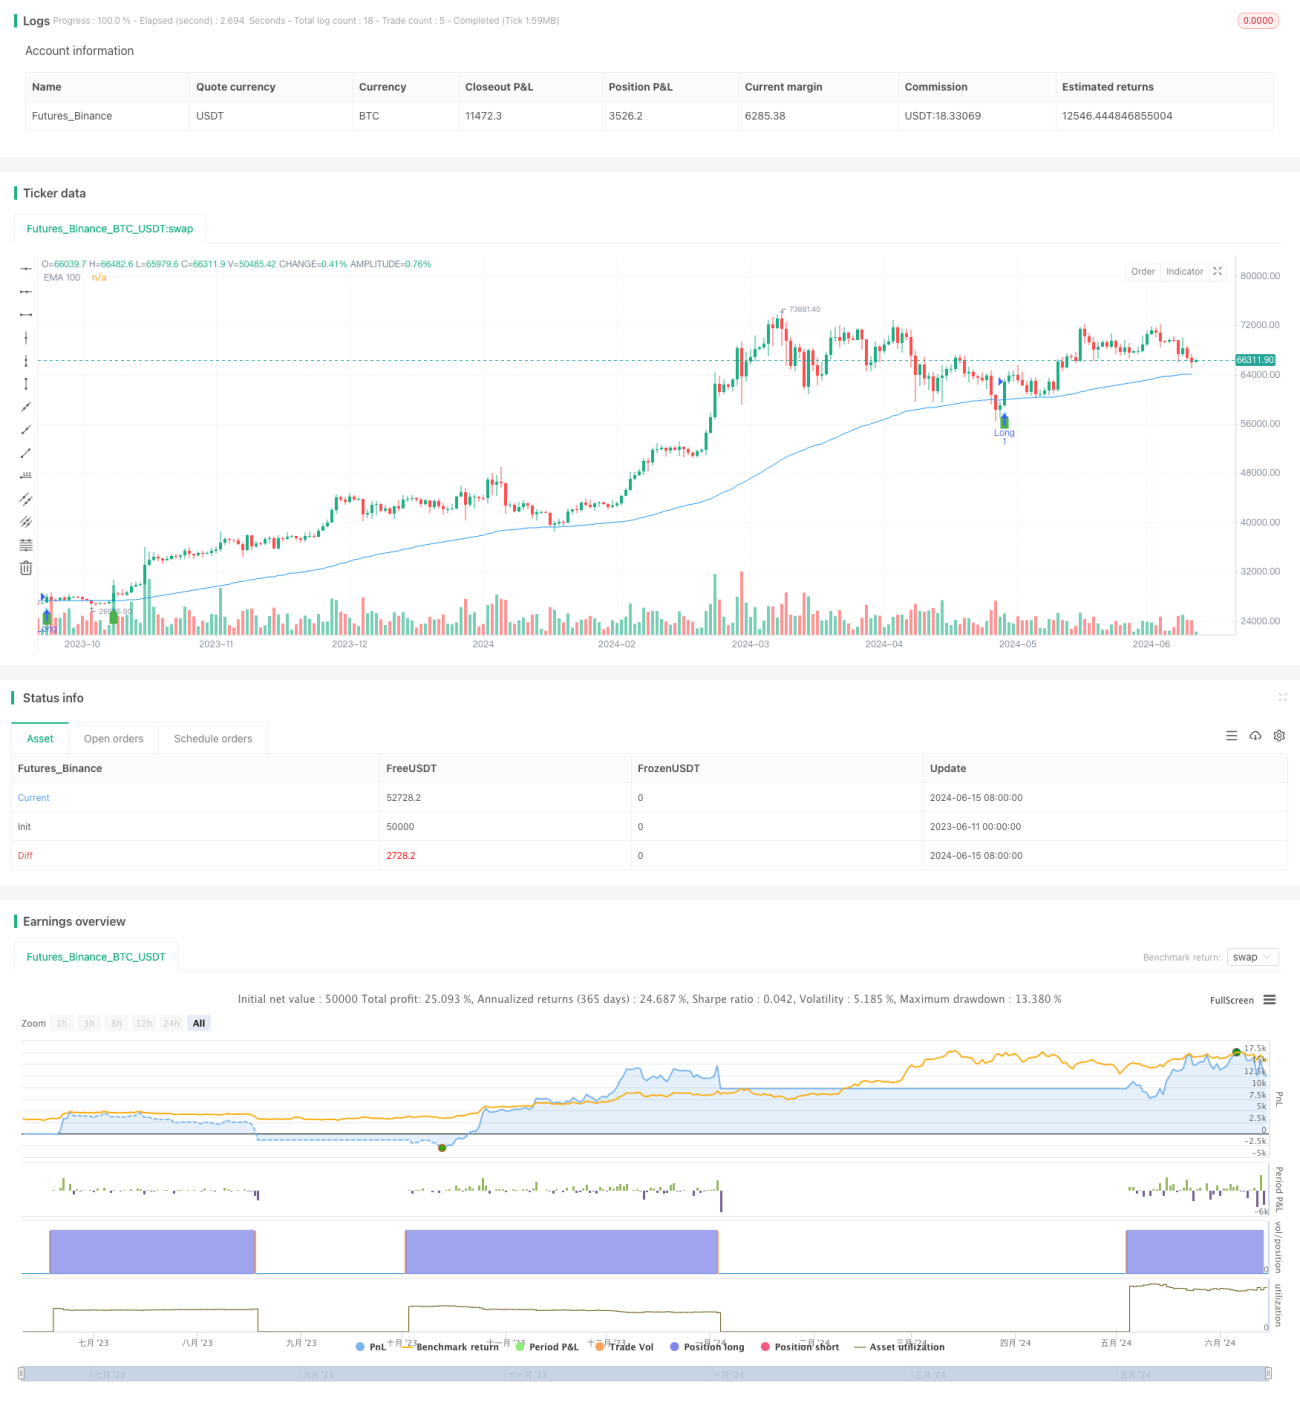
Die Handelsstrategie basiert auf dem 100-Zyklus-Index-Moving Average (EMA100), dem Netto-Unrealized Profit/Loss (NUPL) und den drei Indikatoren des Relativ Unrealized Profit, um ein Handelssignal zu erzeugen, indem sie die Kreuzung des Preises mit EMA100 und die Negativstellung des NUPL und des Relativ Unrealized Profit beurteilt. Es wird ein Mehrsignal ausgelöst, wenn der Preis EMA100 überschreitet und die NUPL und der Relativ Unrealized Profit beide positiv sind; es wird ein Leersignal ausgelöst, wenn der Preis EMA100 überschreitet und die NUPL und der Relativ Unrealized Profit beide negativ sind.
Strategieprinzip
- Berechnung der 100-Zyklus-EMA als Haupttrendindikator
- Nutzung der NUPL und des relativen unrealisierten Gewinns als Hilfsindikatoren zur Bestätigung der Stärke und Nachhaltigkeit von Trends
- Während der Preis die EMA100 über/unter durchbricht, erzeugen die NUPL und die relativ unrealisierten Gewinne gleichzeitig ein Plus/Lose-Signal für positive/negative Zeiten
- 10% Fix-Position mit 10% Stop-Loss und Risikokontrolle
- Wenn Sie eine Überschussposition halten, löschen Sie die Überschussposition aus, wenn der Preis den Stop-Loss-Preis überschreitet. Wenn Sie eine Off-Position halten, löschen Sie die Off-Position aus, wenn der Preis den Stop-Loss-Preis überschreitet.
Analyse der Stärken
- Einfach und leicht zu verstehen: Die Strategie ist klar in der Logik, verwendet gängige technische Kennzahlen und ist leicht zu verstehen und umzusetzen
- Trend-Tracking: Haupttrends werden über EMA100 erfasst, geeignet für den Einsatz in Trendmärkten
- Risikokontrolle: Setzen Sie feste Positionen und Stopps, um das Risiko effektiv zu kontrollieren
- Anpassungsfähigkeit: Die Strategie kann auf verschiedene Märkte und Handelsmarken angewendet werden.
Risikoanalyse
- Falsches Signal: In einem schwankenden Markt kann eine häufige Kreuzung des Preises mit der EMA100 zu einem höheren False Signal führen, was zu Verlusten führt
- Verzögerung: Die EMA als Verzögerungsindikator reagiert möglicherweise langsamer auf eine Trendwende und verpasst die beste Einstiegsmomente
- Optimierung von Parametern: Strategieparameter (wie EMA-Zyklen, Positionsgröße, Stop-Loss-Ratio) müssen für verschiedene Märkte optimiert werden, und unangemessene Parameter können zu einer schlechten Effektivität der Strategie führen
Optimierungsrichtung
- Optimierung von Parametern: Optimierung von Parametern wie EMA-Zyklen, Positionsgröße und Stop-Loss-Ratio, um die Strategie zu verbessern
- Filtersignale: Zusammensetzung mit anderen technischen Indikatoren oder Marktstimmungsindikatoren, um falsche Signale zu filtern
- Dynamische Positionsverwaltung: Positionen werden dynamisch angepasst, um Gewinne zu steigern und Risiken zu kontrollieren, unter anderem aufgrund von Marktschwankungen und Kontoverlusten
- Multi-Flughafen-Portfolio: Halten Sie gleichzeitig mehrere und leere Positionen, um Marktrisiken abzudecken und die Strategie zu stabilisieren
Zusammenfassen
Die Handelsstrategie erzeugt Handelssignale durch EMA100, NUPL und drei Indikatoren für die relativ unerreichte Gewinnrate. Sie hat Vorteile wie Logikklarheit, Risikokontrolle und Anpassungsfähigkeit. Es gibt auch Risiken wie Falschsignale, Rückstand und Parameteroptimierung. In der Zukunft kann die Strategie durch Parameteroptimierung, Signalfilterung, dynamische Positionsverwaltung und Multi-Funktionskombinationen optimiert und verbessert werden.
- 1