EMA dynamische Stop-Loss-Handelsstrategie

Überblick
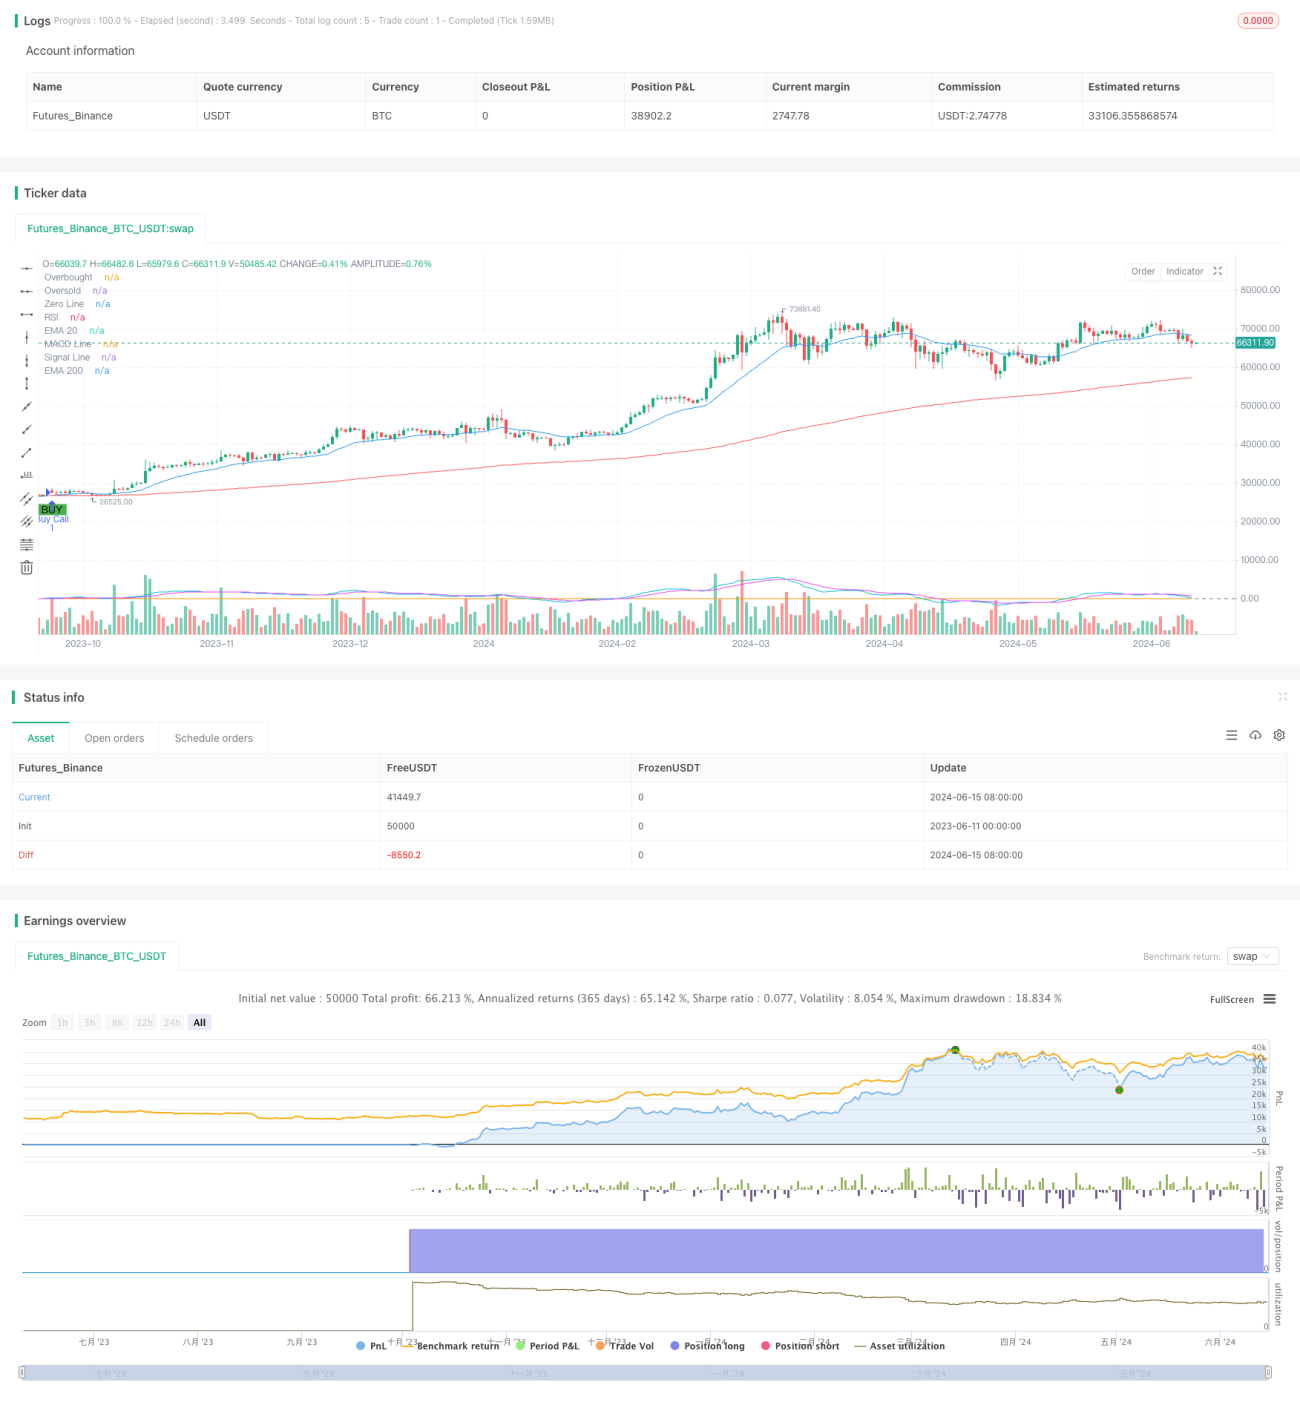
Die Strategie basiert auf dem Kreuzsignal der 20- und 200-Tage-Indikator-Moving Averages (EMA) und wird in Kombination mit dem relativ starken RSI und dem Moving Average Convergence Spread (MACD) bestätigt, um ein Kauf- und Verkaufssignal zu erzeugen. Die Strategie verwendet gleichzeitig eine dynamische Stop-Loss- und Fixed Target-Gewinn-Methode, um das Handelsrisiko zu verwalten und Gewinne zu sperren.
Strategieprinzip
- Die 20- und 200-Tage-EMA werden berechnet, wenn ein Kaufsignal erzeugt wird, wenn ein 200-Tage-EMA auf der 20-Tage-EMA überschritten wird. Wenn ein 200-Tage-EMA unter der 20-Tage-EMA überschritten wird, wird ein Verkaufssignal erzeugt.
- Die Bestätigung der EMA-Kreuzsignale mit dem RSI und dem MACD erfolgt nur dann, wenn der RSI über 50 liegt und die MACD-Linie über der Signallinie liegt. Der Verkauf erfolgt nur dann, wenn der RSI unter 50 liegt und die MACD-Linie unter der Signallinie liegt.
- Setzen Sie eine festgelegte Zielrendite (z. B. 20%) und eine anfängliche Stop-Loss-Rate (z. B. 10%).
- Steigern Sie den Stop-Loss-Preis auf unter 10% des aktuellen Preises, um einen dynamischen Stop-Loss zu erzielen, wenn die Gewinne aus der Haltestelle die Ziel-Rendite erreichen.
- Wenn der Preis den dynamischen Stop-Loss-Preis berührt, ist die Off-Position profitabel.
Strategische Vorteile
- In Kombination mit mehreren technischen Indikatoren bestätigt das Handelssignal die Reliabilität des Signals.
- Die Verwendung von dynamischen Stop-Loss-Methoden, die den Preisen einen gewissen Rückzugsraum geben, während die Gewinne gesperrt werden, verhindert, dass die Position zu früh platziert wird.
- Festgelegte Zielrenditen helfen, Risiken zu kontrollieren und stabile Erträge zu erzielen.
Strategisches Risiko
- EMA-Kreuzsignale können zu häufigen Falschsignalen führen, was zu erhöhten Handelskosten führt.
- Die Strategie kann in einem bewegten Markt zu einem fortlaufenden Verlust führen.
- Festgelegte Ziel-Renditen und Stop-Loss-Raten sind möglicherweise nicht an unterschiedliche Marktbedingungen angepasst und müssen an die Volatilität des Marktes angepasst werden.
Richtung der Strategieoptimierung
- Einführung von mehr technischen Indikatoren oder Marktstimmungsindikatoren, um die Genauigkeit und Zuverlässigkeit der Signale zu verbessern.
- Anpassung der Zielgewinn- und Stop-Loss-Rate an die Marktvolatilität und die Eigenschaften der Vermögenswerte
- In Kombination mit Markttrends und Schwankungszyklen werden in verschiedenen Marktumgebungen unterschiedliche Parameter-Sets verwendet.
Zusammenfassen
Die Strategie, die durch EMA-Kreuzsignale in Kombination mit RSI- und MACD-Bestätigungen sowie durch eine Risikomanagementmethode mit dynamischen Stop-Losses und festen Zielgewinns, zu stabilen Gewinnen in trendigen Märkten führt. In einem schwankenden Markt kann die Strategie jedoch mit einem Risiko von häufigen Transaktionen und fortlaufenden Verlusten konfrontiert sein. Daher sind weitere Optimierungen und Verbesserungen erforderlich, um die Anpassungsfähigkeit und Robustheit der Strategie zu verbessern.
- 1