EMA Bullish Moving Average Crossover-Strategie

Überblick
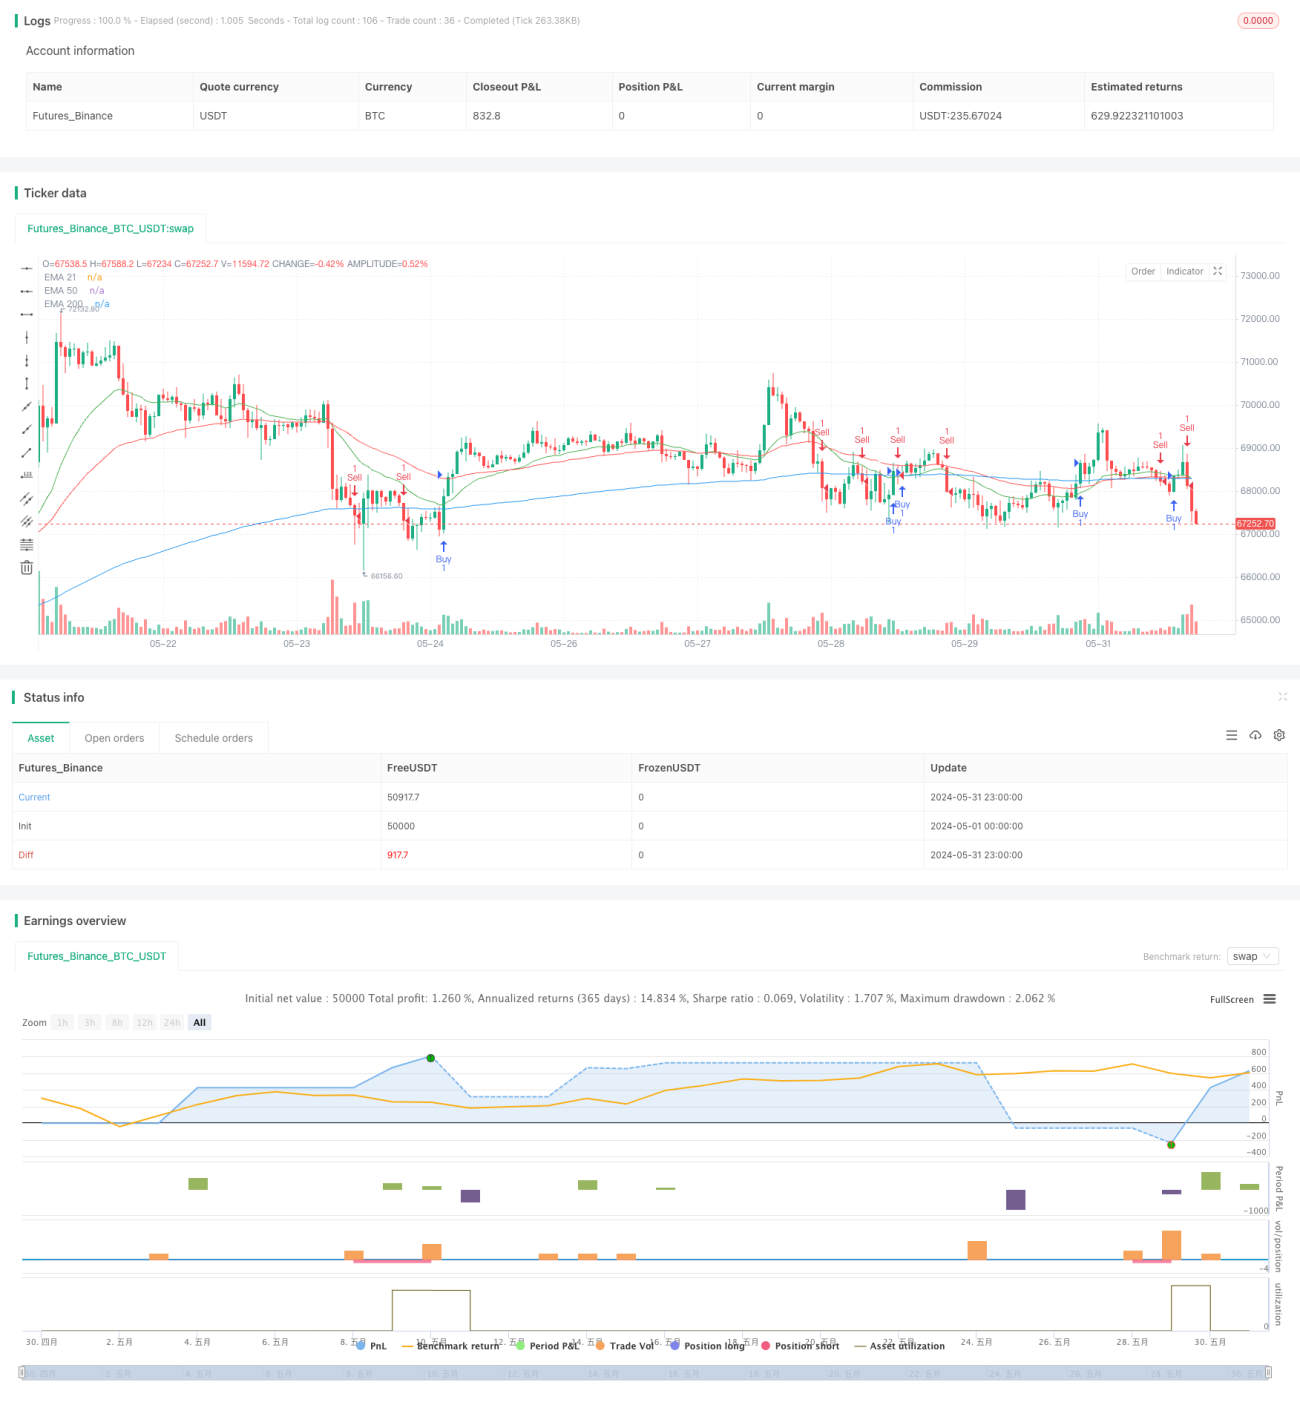
Die Strategie verwendet drei verschiedene Perioden des Index Moving Averages (EMA) und des Relative Strength Index (RSI) zur Beurteilung von Markttrends und Handelssignalen. Sie erzeugt ein Kaufsignal, wenn der Preis die 200-Tage-EMA überschreitet und der RSI größer als 50 ist, und ein Verkaufsignal, wenn der Preis die 200-Tage-EMA überschreitet und der RSI kleiner als 50 ist.
Strategieprinzip
- Die 200-, 50- und 21-Tage-EMA sind in blauen, roten und grünen Linien dargestellt.
- Berechnen Sie den 14-Zyklus-RSI.
- Wenn der Schlusskurs die 200-Tage-EMA überschreitet und der RSI größer als 50 ist, wird ein Kaufsignal erzeugt.
- Ein Verkaufssignal wird erzeugt, wenn der Schlusskurs die 200-Tage-EMA überschreitet und der RSI unter 50 liegt.
- Die Positionsgröße beträgt 1% des Nettowerts des Kontos.
- Die Stop-Loss-Position des Kaufgeschäfts liegt 50 Punkte unter der 200-Tage-EMA, die Stop-Loss-Position liegt 100 Punkte über dem Kaufpreis.
- Die Stop-Loss-Position des Verkaufs liegt 50 Punkte über der 200-Tage-EMA, die Stop-Loss-Position liegt 100 Punkte unter dem Verkaufspreis.
Strategische Vorteile
- In Kombination mit Preis- und Dynamik-Indikatoren hilft dies dabei, die Zeitpunkte für die Entstehung und Umkehr von Trends zu erfassen.
- Drei unterschiedliche EMA-Perioden können kurz-, mittelfristig- und langfristige Trends vollständig widerspiegeln und die Signalfrequenz und das Falschsignal verringern.
- Der RSI filtert Handelssignale in den schwächeren Märkten und reduziert so den Verlust.
- Die Festlegung eines prozentualen Positionsanteils ist für die Risikokontrolle von Vorteil.
- Ein Stop-Loss-Stopp, um das Risiko eines einzelnen Handels zu verhindern.
Strategisches Risiko
- Die Verzögerung des Trendwechselsignals kann zu einem Teilverlust der Gewinne führen.
- Der RSI-Signal kann bei starken Trends zu früh zu einem Rückschlag führen.
- Die Fixed-Percentage-Position ist bei hoher Volatilität riskanter.
- Ein Stop-Loss, der zu nahe an der 200-Tages-Mittellinie liegt, kann zu häufigen Stopps führen.
Richtung der Strategieoptimierung
- Einführung von mehr mittelfristigen und langfristigen Mittellinienkombinationen zur Optimierung des Signals.
- Der RSI-Abweichung und dem Überkauf-Überverkauf wird zugrunde gelegt.
- Die Positionsgröße wird dynamisch angepasst, basierend auf Volatilitätsindikatoren wie ATR.
- Optimierung der Stop-Loss-Stoppposition, z. B. durch Einstellungen nach Trägerwiderstand, Prozentsatz oder ATR
- Die Einführung von Trendfilterbedingungen, wie beispielsweise der ADX-Index, um den Handel in den schwindelerregenden Märkten zu vermeiden.
- Parameteroptimierung und Rückmeldungsprüfung für verschiedene Parameter und Perioden.
Zusammenfassen
Die Strategie kann durch Handelssignale zwischen EMA-Mehrkopf-Aufstellung und RSI-Strength-Bereich relativ klare mittlere und langfristige Trendbewegungen zu erfassen. Aber in der Regel in der Anfangsphase der Trendwende und in der Schaukel-Markt, insgesamt geeignet für trendigen Markt. Die Folge kann weiter optimiert werden, um die Strategie Stabilität und Ertrags-Risiko-Verhältnis von Signal, Position, Stop-Loss-Stop, Filter-Bedingungen, etc. zu verbessern.
- 1