Umfassende dynamische Handelsstrategie mit mehreren Indikatoren

EMA RSI SMA TP SL
Erstellungsdatum: 2024-07-30 17:29:59 zuletzt geändert: 2024-07-30 17:29:59
Kopie: 0 Klicks: 521
1
konzentrieren Sie sich auf
1617
Anhänger

Umfassende dynamische Handelsstrategie mit mehreren Indikatoren

Überblick

Die Strategie ist ein integriertes Handelssystem, das auf mehreren technischen Indikatoren basiert und hauptsächlich Indikatoren wie den Moving Average (EMA), den Relativ Strong Index (RSI) und den Handelsvolumen verwendet, um Handelssignale zu erzeugen und Positionen zu verwalten. Die Strategie verwendet EMA-Kreuzungen, um Markttrends zu bestimmen, während die RSI-Indikatoren verwendet werden, um Über- und Überkäufe zu beurteilen, und in Verbindung mit dem Handelsvolumen, um die Signalstärke zu bestätigen. Zusätzlich enthält die Strategie eine dynamische Stop-Loss-Mechanik und eine feste Haltedauer, um Risiken zu kontrollieren und die Handelsleistung zu optimieren.

Strategieprinzip

  1. Handelssignale werden erzeugt:

    • Mehrköpfiger Einstieg: EMA89 auf EMA34 und RSI größer als 30
    • Eintritt ohne Kopf: EMA 89 unter EMA 34 und RSI unter 70
  2. Die Dynamik des Stopps und Stopps:

    • Aktualisieren Sie den Stop-Loss-Preis, wenn die Transaktionsmenge größer ist als das Dreifache der durchschnittlichen Transaktionsmenge der 20 K-Linien
    • Der Stop-Loss-Preis ist auf den Schlusskurs bei hohem Handelsvolumen festgelegt
  3. Dabei handelt es sich um eine “Fixed Holding”:

    • Zwangs-Plating von 15 K-Linien, unabhängig vom Gewinn oder Verlust
  4. EMA-Stillstand:

    • Verwenden von EMA34 als dynamische Stop Lines
  5. Transaktionsvolumen bestätigt:

    • Benutzung von hohen Volumenbedingungen zur Bestätigung der Signalstärke und Aktualisierung des Stop-Loss-Preises

Strategische Vorteile

  1. Multi-Indikator-Synergie: Die Kombination von EMA, RSI und Handelsvolumen ermöglicht eine umfassende Analyse der Marktsituation und erhöht die Signalsicherheit.

  2. Dynamisches Risikomanagement: Stop-Loss-Anpassungen in Echtzeit an Marktschwankungen, die sich an unterschiedliche Marktbedingungen anpassen.

  3. Fixed-Holding-Zeit: Vermeiden Sie die Risiken einer langfristigen Position und kontrollieren Sie die Expositionszeit für jeden Handel.

  4. EMA-Dynamische Stopps: Die Gleichung wird als Resistenz für die dynamische Unterstützung verwendet, um einen flexibleren Stop-Loss-Schutz zu bieten.

  5. Bestätigung der Transaktionsmenge: Die Bestätigung der Signalstärke und die Erhöhung der Transaktionsgenauigkeit wird durch die Nutzung von Transaktionsmengen-Breakings ermöglicht.

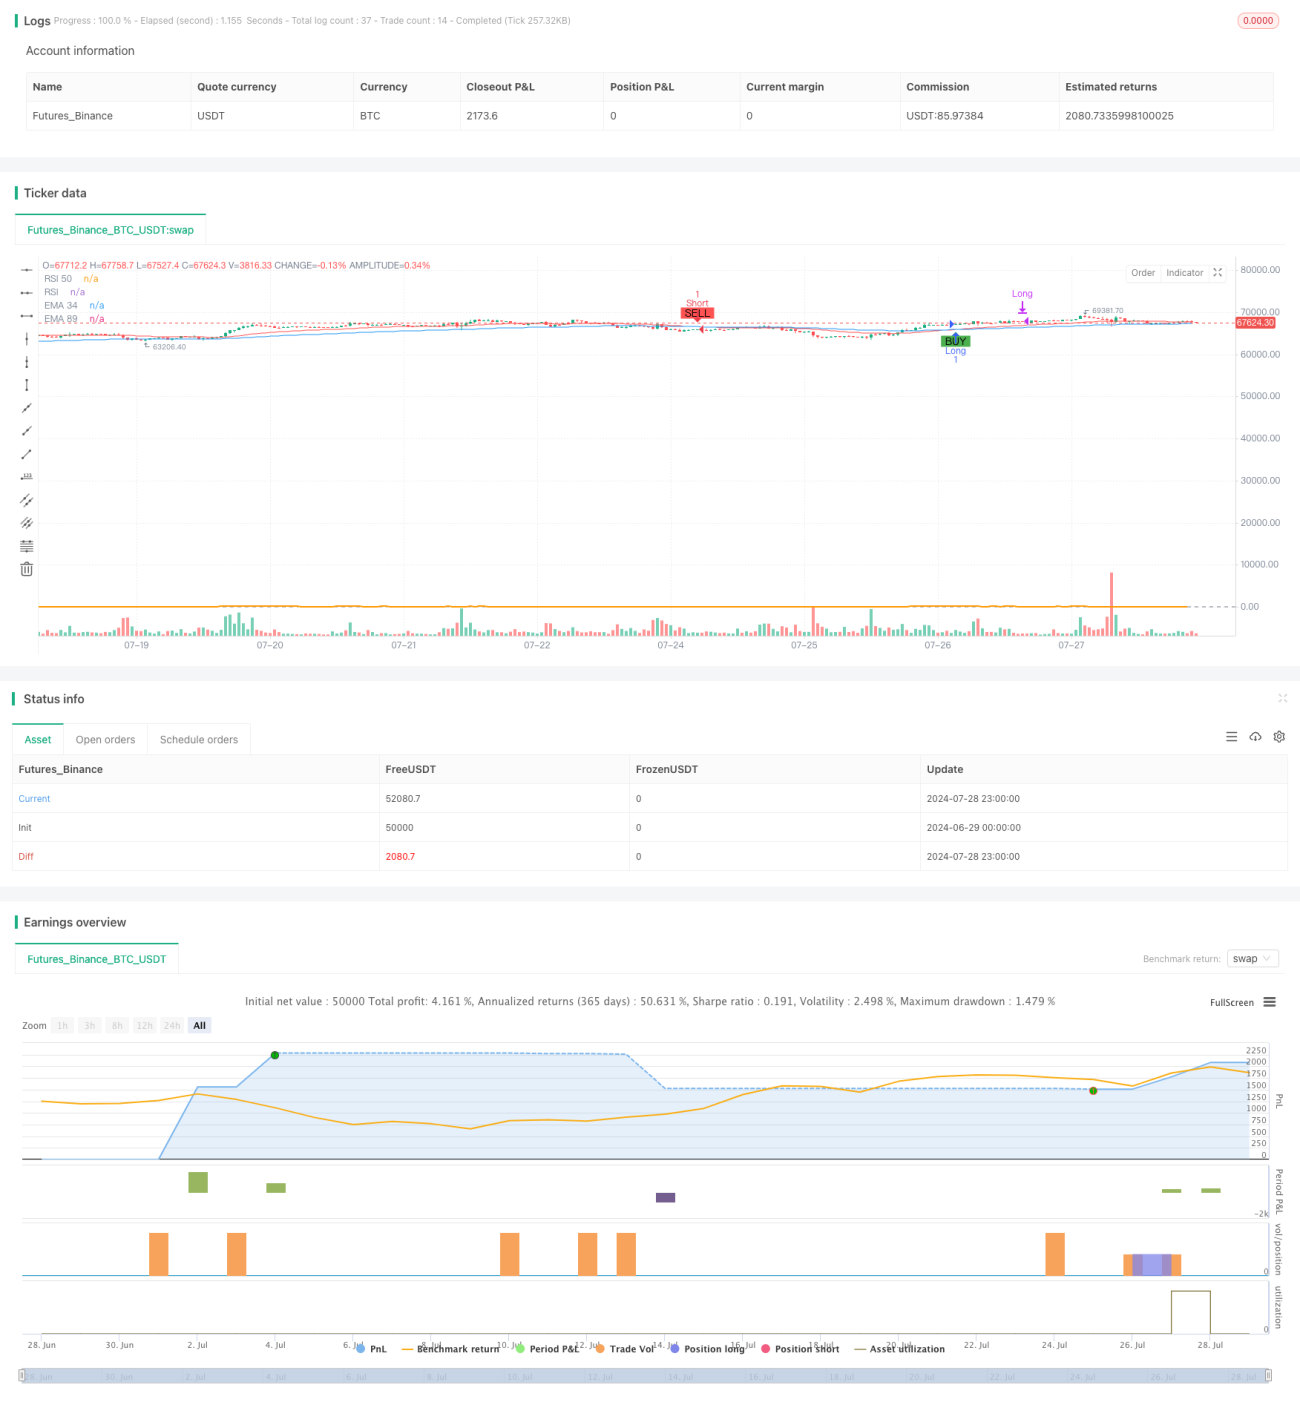
  6. Visuelle Hilfe: Markierung von Kauf- und Verkaufssignalen und wichtigen Preisniveaus in Diagrammen zur Erleichterung der Analyse und Entscheidungsfindung

Strategisches Risiko

  1. Schwankungsrisiko: In schwankenden Märkten können EMA-Kreuzungen häufig falsche Signale erzeugen.

  2. Fixed RSI Thresholds: Fixed RSI Thresholds sind möglicherweise nicht für alle Marktumstände geeignet.

  3. Der Wert von 3 mal der durchschnittlichen Handelsmenge kann zu hoch oder zu niedrig sein, was je nach Markt angepasst werden muss.

  4. Festplatzierungszeitbeschränkung: Die Festplatzierungszeit der K-Linie kann zu einem vorzeitigen Abschluss eines gewinnbringenden Handels führen.

  5. Stop-Loss-Preise: Der Schlusskurs bei einem hohen Handelsvolumen kann als Stop-Loss-Preis nicht ausreichend optimiert sein.

Richtung der Strategieoptimierung

  1. Dynamische RSI-Trench: Überkauf-Überverkauf-Trench, der automatisch an die Marktvolatilität angepasst wird.

  2. Optimierung der Abwertung der Transaktionsmenge: Einführung eines Anpassungsmechanismus, der die Transaktionsmenge anhand der Dynamik der historischen Daten an die Multiplikation anpasst.

  3. Verbesserte Haltezeitmanagement: Dynamische Anpassung der maximalen Haltezeit in Kombination mit Trendstärke und Ertragslage.

  4. Optimierung der Stop-Loss-Einstellungen: Erwägen Sie die Einführung eines ATR-Indikators, um die Stop-Loss-Preise entsprechend der dynamischen Marktfluktuation einzustellen.

  5. Hinzufügen von Trendfiltern: Einführung von langfristigen EMAs oder Trendindikatoren, um den Handel in der entgegengesetzten Richtung des Haupttrends zu vermeiden.

  6. Einführung von Price Behavior Analysis: K-Line-Form und Unterstützungswiderstands-Level kombiniert, um die Genauigkeit von Einstieg und Ausstieg zu verbessern.

  7. Erwägen Sie die Einführung von Rückzugskontrollen: Setzen Sie maximale Rückzugsgrenzen, um die Platzierung zu erzwingen, wenn ein bestimmter Rückzugspegel erreicht wird.

Zusammenfassen

Diese multidimensionelle, dynamische, dynamische Handelsstrategie, die EMA, RSI und Handelsvolumen kombiniert, erzeugt ein umfassendes Handelssystem. Sie kann nicht nur Markttrends erfassen, sondern auch Risiken durch dynamische Stop-Loss- und Fixed-Hold-Zeiten verwalten. Die Stärken der Strategie liegen in ihrer mehrdimensionalen Analyse und flexiblen Risikomanagement, aber auch in den Herausforderungen, die sich aus dem Wandel der Marktumgebung ergeben.

Strategiequellcode
/*backtest
start: 2024-06-29 00:00:00
end: 2024-07-29 00:00:00
period: 1h
basePeriod: 15m
exchanges: [{"eid":"Futures_Binance","currency":"BTC_USDT"}]
*/

//@version=5
strategy("EMA & RSI Strategy", overlay=true)

// Install indicators
ema34 = ta.ema(close, 34)
ema89 = ta.ema(close, 89)
ema54 = ta.ema(close, 54)
ema150 = ta.ema(close, 150)
rsi = ta.rsi(close, 14)

// Draw indicator
plot(ema34, color=color.red, title="EMA 34")
plot(ema89, color=color.blue, title="EMA 89")
//plot(ema54, color=color.green, title="EMA 54")
//plot(ema150, color=color.yellow, title="EMA 150")
hline(50, "RSI 50", color=color.gray)
plot(rsi, title="RSI", color=color.orange, linewidth=2, offset=-1)

// condition long or short
longCondition = ta.crossover(ema34, ema89) and rsi > 30
shortCondition = ta.crossunder(ema34, ema89) and rsi < 70

// Add strategy long
if (longCondition)
    strategy.entry("Long", strategy.long)

// Add strategy short
if (shortCondition)
    strategy.entry("Short", strategy.short)

// Calculate the average volume of previous candles
length = 20 // Number of candles to calculate average volume
avgVolume = ta.sma(volume, length)
highVolumeCondition = volume > 3 * avgVolume

// Determine take profit and stop loss prices when there is high volume
var float takeProfitPriceLong = na
var float stopLossPriceLong = na
var float takeProfitPriceShort = na
var float stopLossPriceShort = na

if (longCondition)
    takeProfitPriceLong := na
    stopLossPriceLong := na

if (shortCondition)
    takeProfitPriceShort := na
    stopLossPriceShort := na

// Update take profit and stop loss prices when volume is high
if (strategy.opentrades.entry_id(0) == "Long" and highVolumeCondition)
    takeProfitPriceLong := close
    stopLossPriceLong := close

if (strategy.opentrades.entry_id(0) == "Short" and highVolumeCondition)
    takeProfitPriceShort := close
    stopLossPriceShort := close

// Execute exit orders for buy and sell orders when there is high volume
if (not na(takeProfitPriceLong))
    strategy.exit("Take Profit Long", from_entry="Long", limit=takeProfitPriceLong, stop=stopLossPriceLong)

if (not na(takeProfitPriceShort))
    strategy.exit("Take Profit Short", from_entry="Short", limit=takeProfitPriceShort, stop=stopLossPriceShort)

// Track the number of candles since the order was opened
var int barsSinceEntryLong = na
var int barsSinceEntryShort = na
var bool longPositionClosed = false
var bool shortPositionClosed = false

if (longCondition)
    barsSinceEntryLong := 0
    longPositionClosed := false
if (shortCondition)
    barsSinceEntryShort := 0
    shortPositionClosed := false

if (strategy.opentrades.entry_id(0) == "Long")
    barsSinceEntryLong := barsSinceEntryLong + 1

if (strategy.opentrades.entry_id(0) == "Short")
    barsSinceEntryShort := barsSinceEntryShort + 1

// Check the conditions to close the order at the 15th candle
if (strategy.opentrades.entry_id(0) == "Long" and barsSinceEntryLong >= 15 and not longPositionClosed)
    strategy.close("Long")
    longPositionClosed := true

if (strategy.opentrades.entry_id(0) == "Short" and barsSinceEntryShort >= 15 and not shortPositionClosed)
    strategy.close("Short")
    shortPositionClosed := true

// Thêm stop loss theo EMA34
if (strategy.opentrades.entry_id(0) == "Long")
    strategy.exit("Stop Loss Long", from_entry="Long", stop=ema34)
if (strategy.opentrades.entry_id(0) == "Short")
    strategy.exit("Stop Loss Short", from_entry="Short", stop=ema34)

// Displays buy/sell signals and price levels on the chart
plotshape(series=longCondition, location=location.belowbar, color=color.green, style=shape.labelup, text="BUY")
plotshape(series=shortCondition, location=location.abovebar, color=color.red, style=shape.labeldown, text="SELL")

// Displays take profit and stop loss prices on the chart
// var line takeProfitLineLong = na
// var line stopLossLineLong = na
// var line takeProfitLineShort = na
// var line stopLossLineShort = na

// if (not na(takeProfitPriceLong)) 
//     if na(takeProfitLineLong)
//         takeProfitLineLong := line.new(x1=bar_index, y1=takeProfitPriceLong, x2=bar_index + 1, y2=takeProfitPriceLong, color=color.blue, width=1, style=line.style_dashed)
//     else
//         line.set_xy1(takeProfitLineLong, x=bar_index, y=takeProfitPriceLong)
//         line.set_xy2(takeProfitLineLong, x=bar_index + 1, y=takeProfitPriceLong)

// if (not na(stopLossPriceLong)) 
//     if na(stopLossLineLong)
//         stopLossLineLong := line.new(x1=bar_index, y1=stopLossPriceLong, x2=bar_index + 1, y2=stopLossPriceLong, color=color.red, width=1, style=line.style_dashed)
//     else
//         line.set_xy1(stopLossLineLong, x=bar_index, y=stopLossPriceLong)
//         line.set_xy2(stopLossLineLong, x=bar_index + 1, y=stopLossPriceLong)

// if (not na(takeProfitPriceShort)) 
//     if na(takeProfitLineShort)
//         takeProfitLineShort := line.new(x1=bar_index, y1=takeProfitPriceShort, x2=bar_index + 1, y2=takeProfitPriceShort, color=color.blue, width=1, style=line.style_dashed)
//     else
//         line.set_xy1(takeProfitLineShort, x=bar_index, y=takeProfitPriceShort)
//         line.set_xy2(takeProfitLineShort, x=bar_index + 1, y=takeProfitPriceShort)

// if (not na(stopLossPriceShort)) 
//     if na(stopLossLineShort)
//         stopLossLineShort := line.new(x1=bar_index, y1=stopLossPriceShort, x2=bar_index + 1, y2=stopLossPriceShort, color=color.red, width=1, style=line.style_dashed)
//     else
//         line.set_xy1(stopLossLineShort, x=bar_index, y=stopLossPriceShort)
//         line.set_xy2(stopLossLineShort, x=bar_index + 1, y=stopLossPriceShort)

// // Shows annotations for take profit and stop loss prices
// if (not na(takeProfitPriceLong))
//     label.new(x=bar_index, y=takeProfitPriceLong, text="TP Long", style=label.style_label_down, color=color.blue, textcolor=color.white)
// if (not na(stopLossPriceLong))
//     label.new(x=bar_index, y=stopLossPriceLong, text="SL Long", style=label.style_label_up, color=color.red, textcolor=color.white)
// if (not na(takeProfitPriceShort))
//     label.new(x=bar_index, y=takeProfitPriceShort, text="TP Short", style=label.style_label_up, color=color.blue, textcolor=color.white)
// if (not na(stopLossPriceShort))
//     label.new(x=bar_index, y=stopLossPriceShort, text="SL Short", style=label.style_label_down, color=color.red, textcolor=color.white)