Überblick
Die Strategie nutzt hauptsächlich den relativ starken RSI und den einfachen Moving Average (SMA) zur Identifizierung potenzieller Überkaufszustände und Umkehrmöglichkeiten und optimiert das Risiko-Gewinn-Verhältnis durch die Buchung von Positionen. Die Kernidee der Strategie ist, dass die Vermögenspreise in einem langfristigen Abwärtstrend sind und kurzfristige Überkäufe entstehen, wenn sie ausgelöscht werden, und wenn ein Überverkauf oder ein Trendwechselsignal auf dem Markt auftritt.
Strategieprinzip
Die Strategie umfasst die folgenden Schlüsselschritte:
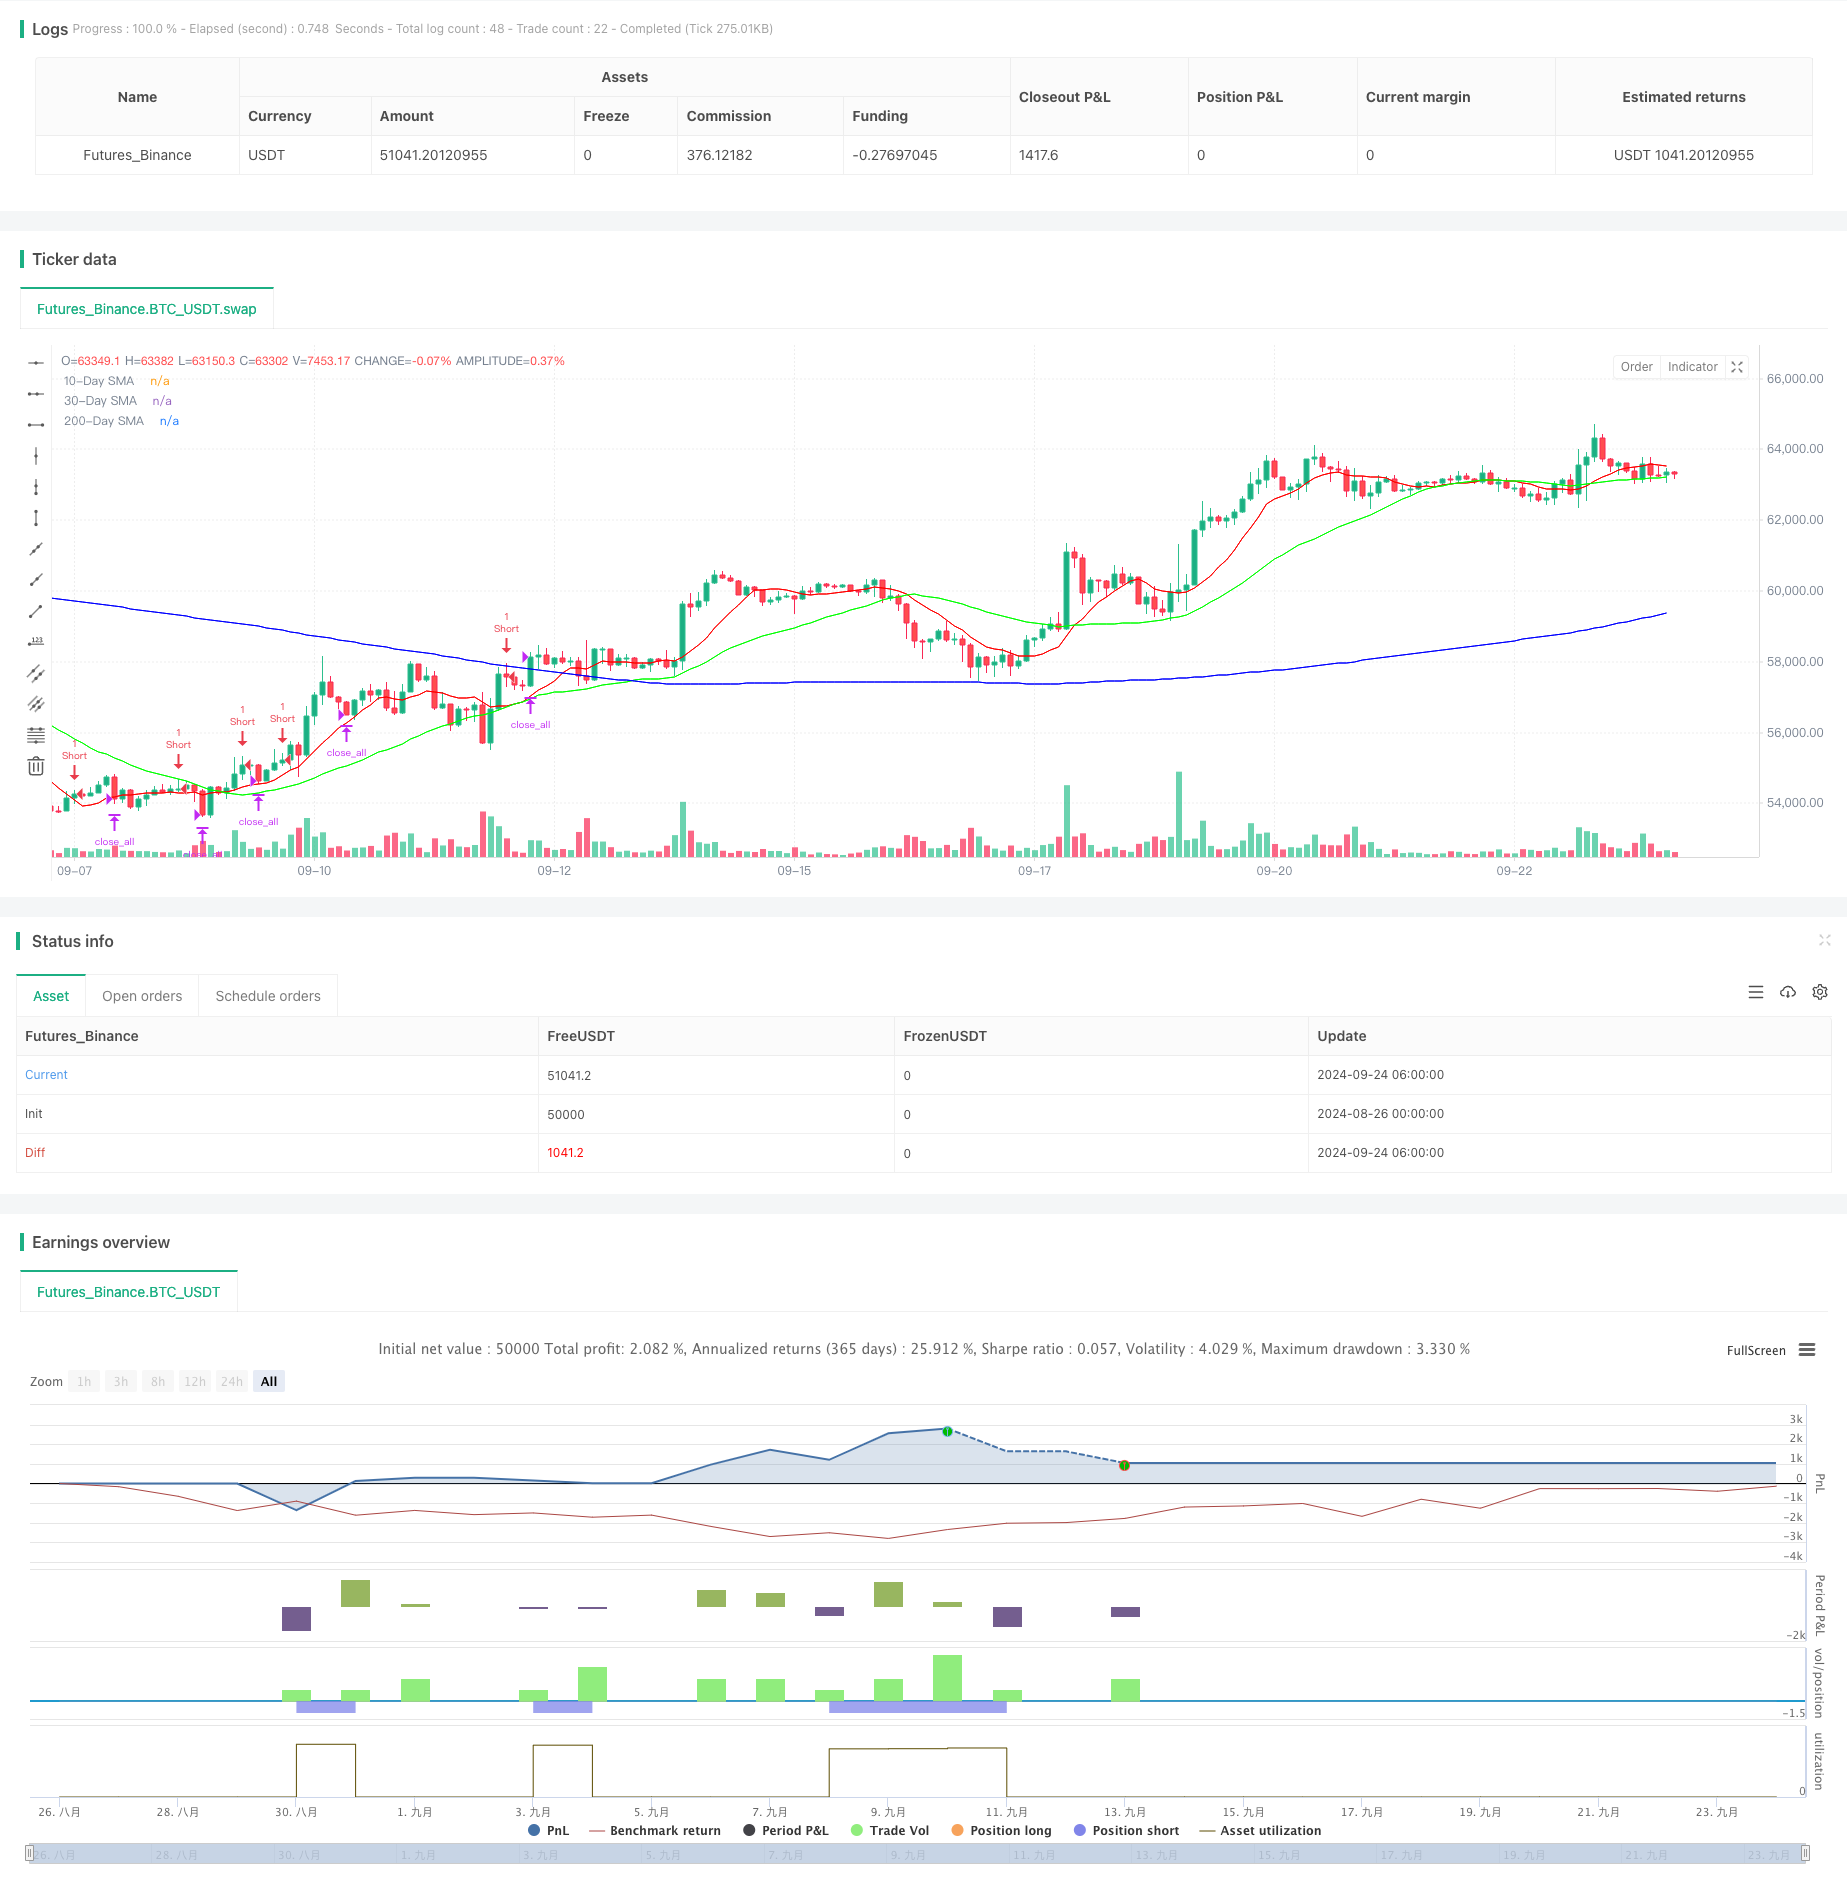
- Langfristige Trendbeurteilung: Der 200-Tage-Simple Moving Average (SMA) wird als langfristiger Trendfilter verwendet. Die Strategie berücksichtigt nur eine Leerlaufchance, wenn der Preis unter dem 200-Tage-SMA liegt.
- Überkauf-Erkennung: Der 2-Zyklus-RSI-Indikator wird verwendet, um kurzfristige Überkauf-Erkenntnisse zu ermitteln, die zwei Tage in Folge über 75 liegen.
- Lagerstätten in Schuhen errichten: Erste Lagerstätten werden mit 10% errichtet, danach werden die Lagerstätten schrittweise erhöht, je nach Preisentwicklung. Wenn der Preis höher ist als der letzte Lagerstättenpreis, werden die Lagerstätten um 20%, 30% und 40% erhöht.
- Ausstiegsbedingungen: Alle Positionen werden ausgeglichen, wenn der 2-Zyklus-RSI unter 30 liegt (was bedeutet, dass ein Überverkauf möglich ist) oder der 30-Tage-SMA über dem 10-Tage-SMA überschritten wird (was bedeutet, dass eine Trendwende möglich ist).
Strategische Vorteile
- Risikokontrolle: Die Risikogrenze für einzelne Geschäfte wird durch Batchbuilding und dynamische Positionsverwaltung effektiv kontrolliert.
- Trend-Tracking: Die Verwendung von Kombinationen aus langfristigen und kurzfristigen Moving Averages erlaubt es, sowohl langfristige Trends zu erfassen als auch kurzfristige Umkehrmöglichkeiten zu erkennen.
- Flexibilität: Strategieparameter können an unterschiedliche Marktbedingungen und Handelsarten angepasst werden.
- Automatisierte Ausführung: Die Strategie ist klar und einfach zu programmieren, um den Handel zu automatisieren.
Strategisches Risiko
- Marktrisiken: Bei starkem Aufwärtstrend besteht die Gefahr, dass die Verluste anhalten.
- Überlagerungsrisiko: Die Bündelung von Bündelungen kann zu einer Überbelichtung des Marktes unter falschen Signalen führen.
- Liquiditätsrisiko: In weniger liquiden Märkten können große Transaktionen zu einem Anstieg der Gleitpunkte führen.
- Einschränkungen bei technischen Indikatoren: Technische Indikatoren wie RSI und SMA können falsche Signale erzeugen, was zu falschen Handelsentscheidungen führt.
Richtung der Strategieoptimierung
- Einführung von Volatilitätsindikatoren: Kombination von Volatilitätsindikatoren wie ATR (Average True Range) und dynamische Anpassung der Positionserhöhung und -senkung.
- Optimierung der Anlagerungslogik: Es kann in Betracht gezogen werden, die Anlagerungsquote dynamisch an die Marktschwankungen anzupassen, um übermäßige Anlagerungen in Zeiten hoher Volatilität zu vermeiden.
- Erhöhung der Basisfilterung: Die Kombination von Basisfaktoren wie Marktstimmungsindikatoren oder makroökonomischen Daten erhöht die Zuverlässigkeit des Einstiegssignals.
- Rücklaufoptimierung: Optimierung der Parameter-Einstellungen durch Rücklauf von großen Mengen an historischen Daten, um die Stabilität und Profitabilität der Strategie zu verbessern.
Zusammenfassen
Die Dynamische Positionsmanagement RSI-Überkauf-Umkehrstrategie ist eine Kurzstrecken-Handelsstrategie, die technische Analyse und Risikomanagement kombiniert. Die Strategie zielt darauf ab, potenzielle Umkehrchancen in den Märkten zu erfassen, indem sie über RSI-Überkaufsignale und SMA-Trends beurteilt.
/*backtest
start: 2024-08-26 00:00:00
end: 2024-09-24 08:00:00
period: 2h
basePeriod: 2h
exchanges: [{"eid":"Futures_Binance","currency":"BTC_USDT"}]
*/

//@version=5
strategy("TPS Short Strategy by Larry Conners", overlay=true)

// Define parameters as inputs
sma_length_200 = input.int(200, title="200-Day SMA Length")
rsi_length_2 = input.int(2, title="2-Period RSI Length")
sma_length_10 = input.int(10, title="10-Day SMA Length")
sma_length_30 = input.int(30, title="30-Day SMA Length")

// Define colors as RGB values
color_sma_200 = input.color(color.rgb(0, 0, 255), title="200-Day SMA Color") // Blue
color_sma_10 = input.color(color.rgb(255, 0, 0), title="10-Day SMA Color") // Red
color_sma_30 = input.color(color.rgb(0, 255, 0), title="30-Day SMA Color") // Green

// Calculate indicators
sma_200 = ta.sma(close, sma_length_200)
rsi_2 = ta.rsi(close, rsi_length_2)
sma_10 = ta.sma(close, sma_length_10)
sma_30 = ta.sma(close, sma_length_30)

// Define conditions
below_sma_200 = close < sma_200
rsi_2_above_75_two_days = rsi_2[1] > 75 and rsi_2 > 75
price_higher_than_entry = na(strategy.opentrades.entry_price(0)) ? false : close > strategy.opentrades.entry_price(0)

// Entry conditions
if (below_sma_200 and rsi_2_above_75_two_days and na(strategy.opentrades.entry_price(0)))
    strategy.entry("Short", strategy.short, qty=1) // Short 10% of the position

// Scaling in conditions
if (price_higher_than_entry)
    strategy.entry("Short2", strategy.short, qty=2) // Short 20% more of the position

if (price_higher_than_entry)
    strategy.entry("Short3", strategy.short, qty=3) // Short 30% more of the position

if (price_higher_than_entry)
    strategy.entry("Short4", strategy.short, qty=4) // Short 40% more of the position

// Exit conditions
exit_condition_rsi_below_30 = rsi_2 < 30
exit_condition_sma_cross = ta.crossover(sma_10, sma_30)

if (exit_condition_rsi_below_30 or exit_condition_sma_cross)
    strategy.close_all() // Close all positions

// Plot indicators
plot(sma_200, color=color_sma_200, title="200-Day SMA")
plot(sma_10, color=color_sma_10, title="10-Day SMA")
plot(sma_30, color=color_sma_30, title="30-Day SMA")