
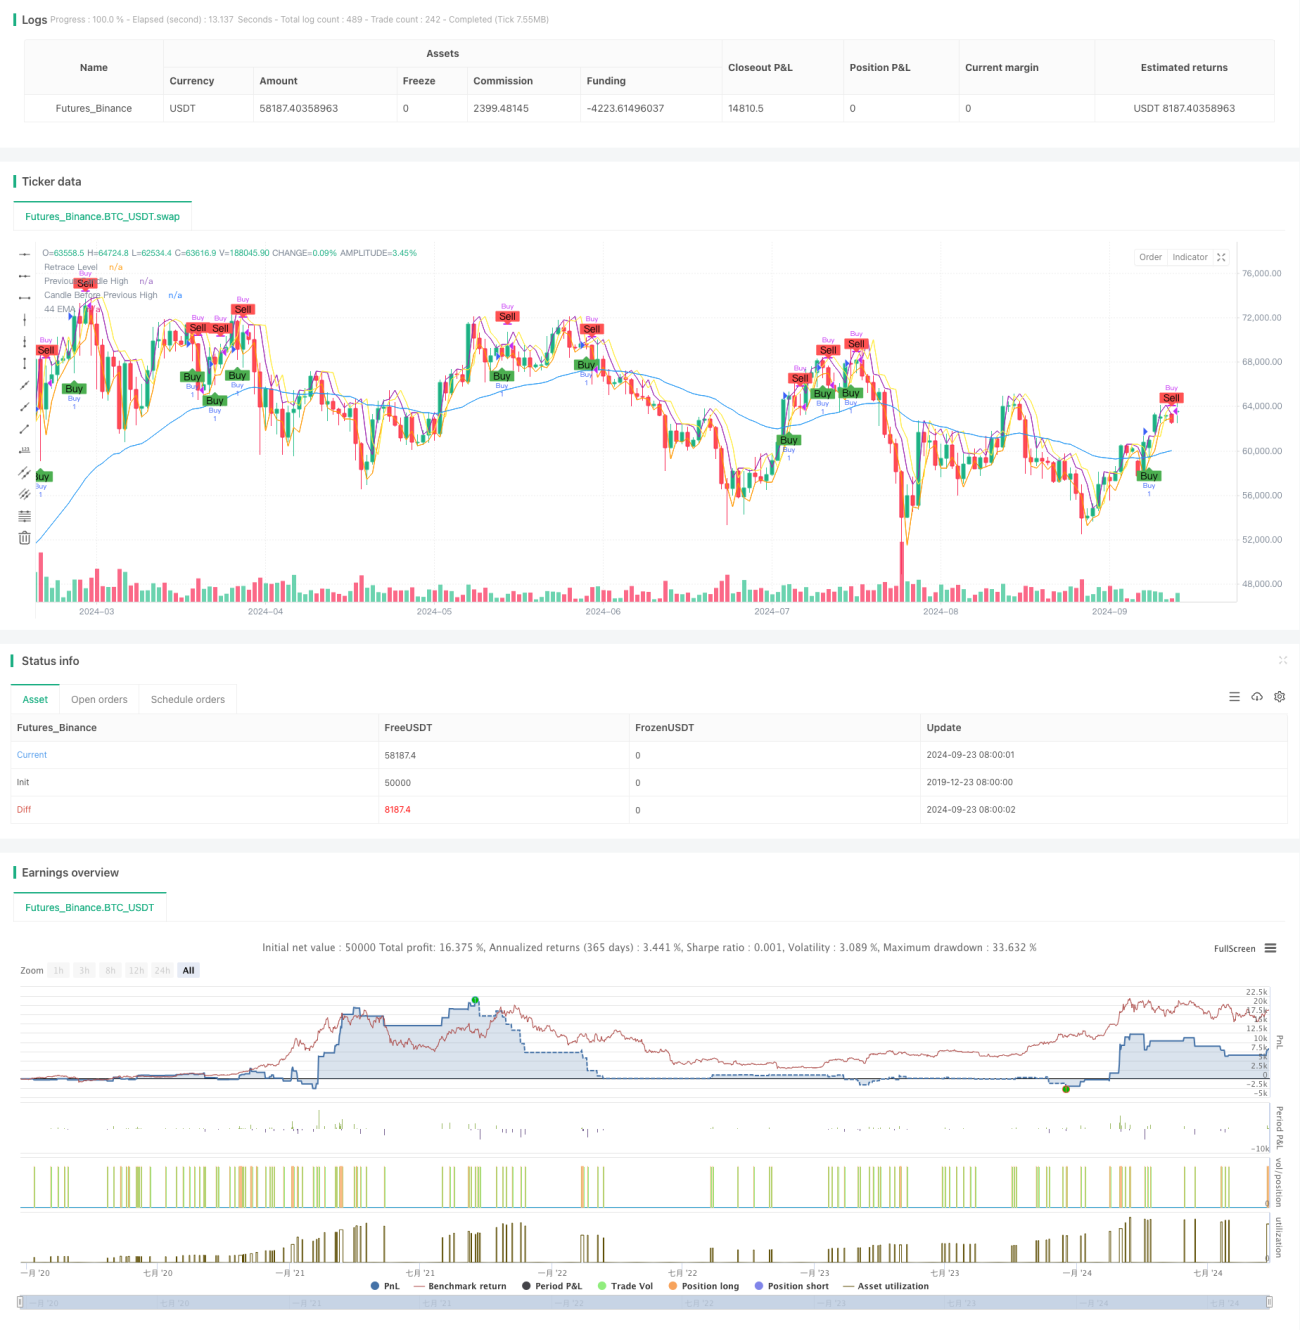
Überblick
Es ist eine Trend-Tracking-Strategie, die auf einem 44-Perioden-Index-Moving Average (EMA) basiert. Die Strategie sucht hauptsächlich nach Kaufmöglichkeiten im Aufwärtstrend und bestimmt den Zeitpunkt des Eintritts durch die Analyse von mehreren Bedingungen wie EMA-Schlange, Graphik und Preisrückzug. Die Strategie ist für kürzere Zeiträume wie 2 Minuten und 5 Minuten konzipiert, um Handelsmöglichkeiten in kurzfristigen Preisbewegungen zu erfassen.
Strategieprinzip
- Berechnen Sie den 44-Zyklus-EMA und seine Schräglage, um zu beurteilen, ob der Trend ausreichend geneigt ist.
- Die Analyse der Form des vorherigen Zyklus erfordert, dass es sich um eine Sonnenstrahlung handelt, die über der EMA liegt.
- Beobachten Sie, ob der aktuelle Stern auf 50% der Position des vorherigen Sterns zurückgreift.
- Sicherstellen, dass der Schlusskurs des vorherigen Rings höher ist als der Höchstwert des vorherigen Rings, um die Beständigkeit des Aufwärtstrends zu überprüfen.
- Wenn alle Voraussetzungen erfüllt sind, wird die Position in der Rücknahmeposition des aktuellen Brennstoffs aufgestockt.
- Die Ausgangskonditionen sind: Der vorherige Tiefpunkt ist die Niedrigste oder der aktuelle Tiefpunkt fällt über den vorherigen Tiefpunkt.
Strategische Vorteile
- Multiple Filter: Kombination von mehreren Indikatoren wie EMA, Graphik und Preisrückzug, um falsche Signale wirksam zu reduzieren.
- Trends Following: Sicherstellen, dass der EMA-Schlange in einem klaren Aufwärtstrend handelt, um die Gewinnquote zu erhöhen.
- Rücktritt-Eintritt: Der Rücktritt des Preises wird als Einstiegspunkt genutzt, um den Kaufpreis zu optimieren und potenziell den Gewinnraum zu erhöhen.
- Flexibilität: Es gibt verschiedene Zeiträume für Short-Line- und Intraday-Händler.
- Risikokontrolle: Es gibt klare Stop-Loss-Bedingungen, die helfen, das Risiko für jeden Handel zu kontrollieren.
Strategisches Risiko
- Verzögerung: Die EMA als Verzögerungsindikator reagiert möglicherweise nicht rechtzeitig bei starken Schwankungen.
- Falsche Durchbrüche: Häufige Falsche Durchbrüche können in der Layout-Zone auftreten.
- Übertriebenheit: In einem sehr schwankenden Markt kann es zu übertriebenen Transaktionen kommen, was zu höheren Transaktionskosten führt.
- Trendwende: Eine schnelle Trendwende kann zu größeren Verlusten führen.
- Parameter-Sensitivität: Strategieeffekte sind empfindlich auf Parameter-Einstellungen wie EMA-Zyklen.
Richtung der Strategieoptimierung
- Einführung von zusätzlichen Filtern wie RSI oder MACD, um die Stärke und Richtung des Trends weiter zu bestätigen.
- Dynamische Stopps: Die ATR-Indikatoren werden verwendet, um dynamische Stopps einzustellen und sich besser an die Marktschwankungen anzupassen.
- Erhöhung der Verkehrsanalyse: Kombination von Verkehrsindikatoren zur Erhöhung der Zuverlässigkeit der Eingangssignale.
- Optimierung der EMA-Zyklen: Die optimale Kombination von Parametern wird durch Rückmessung verschiedener EMA-Zyklen ermittelt.
- Trendstärken hinzufügen, z. B. die ADX, um sicherzustellen, dass nur starke Trends eingesetzt werden.
- Verbesserte Ausstiegsmechanismen: Konzipieren Sie raffiniertere Gewinnstrategie wie Trailing Stops.
Zusammenfassen
Die EMA-Strategie zeigt ein gutes Potenzial bei der Identifizierung von Aufwärtstrends und der Optimierung von Einstiegsmomenten. Die Benutzer müssen jedoch darauf achten, das Risiko eines Überhandels zu kontrollieren und die Parameter für verschiedene Marktumgebungen zu optimieren. Durch die Einführung zusätzlicher technischer Indikatoren und die Verbesserung der Risikomanagementmechanismen wird die Strategie eine stabilere Leistung im kurzfristigen Handel erwarten.
- 1