Adaptive Trendhandelsstrategie, die Bollinger Bands und RSI kombiniert

Überblick
Die Strategie ist ein Trend-Tracking-System, das mehrere technische Indikatoren kombiniert und die drei klassischen Indikatoren Bollinger Bands, RSI und MACD synchronisiert, um Handelschancen in Zeiten von Marktschwankungen und Trendwechseln zu erfassen. Die Strategie verwendet eine pyramidenartige Gewichtung, um das Risiko durch eine strenge Kontrolle des Handelsintervalls zu verwalten.
Strategieprinzip
Die Kernlogik der Strategie basiert auf der dreifachen Signalbestätigung:
- Der RSI-Indikator wird verwendet, um überkaufte und überverkaufte Bereiche zu identifizieren, wobei RSI < 45 als überkauft und RSI > 55 als überkauft gilt
- Preisposition durch Brin-Band-Kanal, das Signal erzeugt, wenn der Preis nahe ist oder den Brin-Band überschreitet
- Die MACD Goldfork-Death Fork als Trendbestätigung verwendet, um Positionen nach Resonanz mit dem RSI und dem Brin-Band-Signal zu eröffnen
Die Strategie setzt außerdem eine minimale Handelsintervalle (15 Zyklen) und vermeidet übermäßige Handelsvorgänge bei gleichzeitiger Anwendung einer pyramidenförmigen Lagerhaltung.
Strategische Vorteile
- Mehrfache technische Kennziffern, Cross-Verifizierung, erhebliche Reduzierung von Falschmeldungen
- Pyramidenanlage verbessert die Effizienz der Kapitalnutzung
- Setzen Sie minimale Handelsintervalle, um die Handelsfrequenz effektiv zu steuern
- Indikatorparameter sind flexibel und flexibel
- Automatische Ausgleichsmechanismen zur Kontrolle der Risikoplätze
Strategisches Risiko
- Mehrere Anzeigen können zu Signalverzögerungen führen
- Häufige Transaktionen in einem wackligen Markt
- Pyramidenhaushalte könnten bei einer Trendwende zu größeren Verlusten führen
- Ein fester RSI-Termine kann nicht für alle Marktbedingungen geeignet sein
Richtung der Strategieoptimierung
- Einführung eines adaptiven RSI-Durchschnitts, der sich dynamisch an Marktvolatilitäten anpasst
- Lautstärkeanzeige als Zusatzbestätigung hinzufügen
- Optimierte Algorithmen zur Positionsverwaltung bei Pyramiden
- Einführung eines flexibleren Stop Loss Mechanismus
- Berücksichtigung der zyklischen Merkmale des Marktes und dynamische Anpassung der Handelsintervalle
Zusammenfassen
Die Strategie verfolgt durch die synchronisierte Kombination von mehreren technischen Indikatoren eine stabile Rendite bei gleichzeitiger Risikokontrolle. Obwohl es einige Rückstände gibt, zeigt die Strategie durch eine vernünftige Parameteroptimierung und Risikomanagement-Mechanismen eine bessere Anpassungsfähigkeit und Stabilität. In der Zukunft kann die Strategie durch die Einführung von Anpassungsmechanismen und eine bessere Positionsverwaltung weiter verbessert werden.
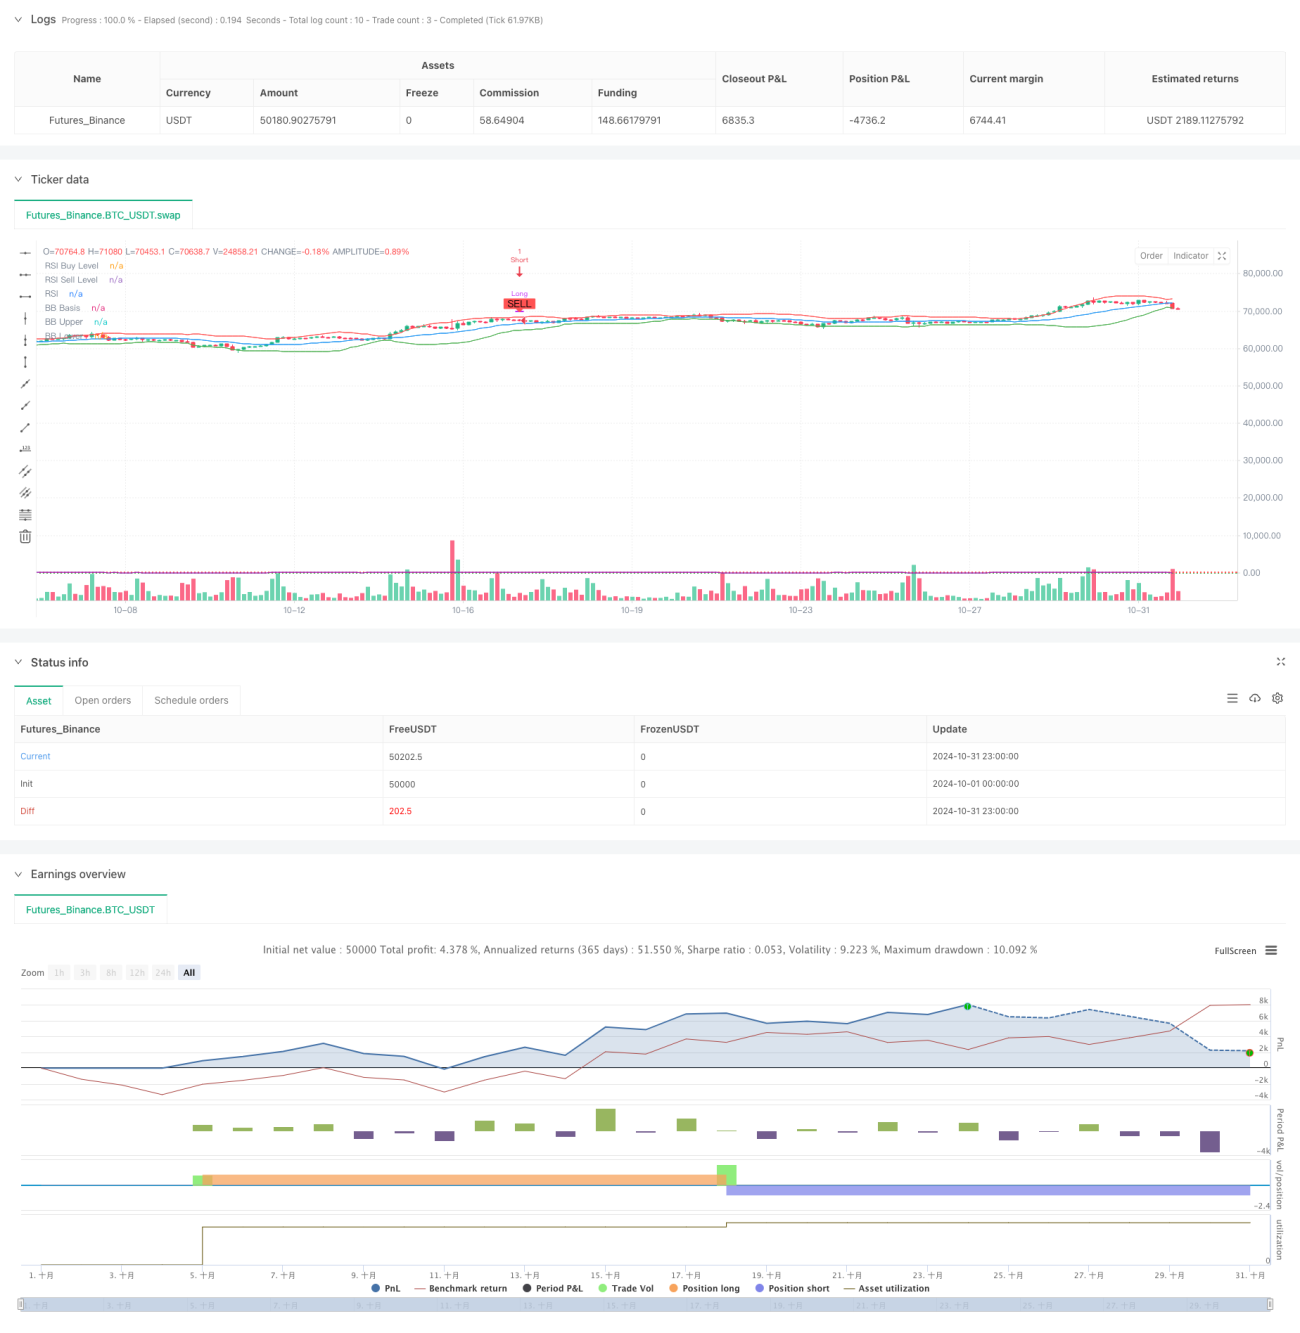
/*backtest
start: 2024-10-01 00:00:00
end: 2024-10-31 23:59:59
period: 3h
basePeriod: 3h
exchanges: [{"eid":"Futures_Binance","currency":"BTC_USDT"}]
*/

//@version=5
strategy("[ETH] Optimized Trend Strategy", shorttitle="Lorenzo-SuperScalping", overlay=true, pyramiding=3, initial_capital=100000, currency=currency.USD)

// === Input Parameters === //- 1