Zweiseitige Handelsstrategie bei großen Volatilitätsausbrüchen: Long- und Short-Einstiegssystem basierend auf der Punkteschwelle

Überblick
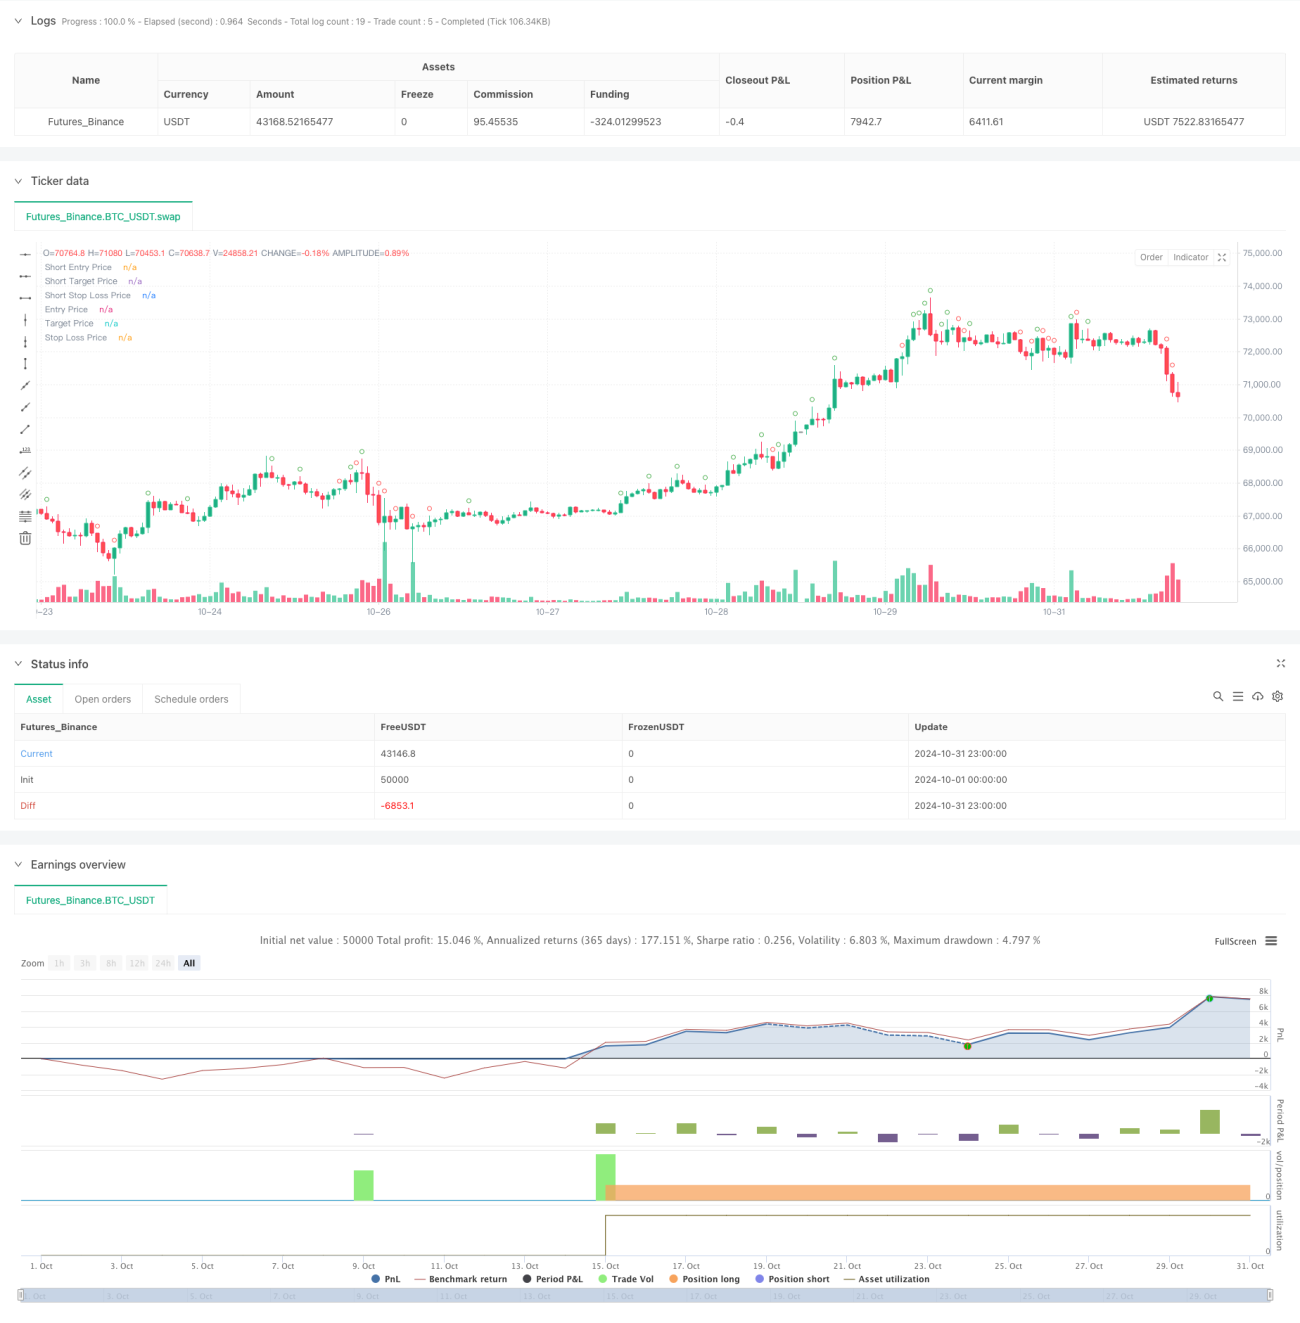
Die Strategie ist ein auf der 30-minütigen K-Linie basierendes, zweiseitiges Handelssystem, das nach Handelsmöglichkeiten sucht, indem es die Schwankungsbreite der Preise überwacht. Die Kernstrategie besteht darin, große Schwankungen zu identifizieren, indem man die Punktdämpfung festlegt, und nach der Bestätigung des Durchbruchs in die entsprechende Richtung zu handeln. Die Strategie enthält strenge Zeitmanagement-, Stop-Loss- und Handelsmanagementmechanismen, um automatisierte Geschäfte mit kontrollierbarem Risiko zu ermöglichen.
Strategieprinzip
Die Strategie verwendet eine Mehrfachfilterung, um ein effektives Handelssignal zu identifizieren. Zunächst berechnet die Strategie die Bandbreite der Fluktuation der Einheit bei der Schließung der K-Linie pro 30 Minuten. Wenn die Fluktuation größer ist als die vorgegebene Schwelle, wird sie als potenzielle Handelsgelegenheit markiert. Um die Effektivität des Handels zu gewährleisten, setzt die Strategie zusätzliche Sicherungspunkte ein, die das tatsächliche Handelssignal nur auslösen, wenn der Preis diese Sicherungszone durchbricht.
Strategische Vorteile
- Perfekte Zeitmanagement: Begrenzung der Zeitfenster für den Handel, um falsche Signale in nicht aktiven Zeiten zu vermeiden
- Zwei-Wege-Trading-Mechanismen: Zwei-Wege-Marktchancen zu nutzen und die Effizienz der Kapitalnutzung zu verbessern
- Gefährdungssteuerung: Einsatz von Fixed-Point-Stop-Losses zur Erleichterung der Risikobewertung und -verwaltung
- Hohe Automatisierungsstufe: Automatisierung des gesamten Prozesses von der Signalerkennung bis zur Transaktionsdurchführung mit geringem menschlichen Eingriff
- Flexible Parameter-Einstellungen: Alle wichtigen Parameter können angepasst werden, um sich an unterschiedliche Marktbedingungen anzupassen
Strategisches Risiko
- False-Breakout-Risiko: False-Breakouts können nach starken Schwankungen auftreten, was zu einem Stop-Loss führt
- Parameter-Sensitivität: Fehlende Threshold-Einstellungen können zu verpassten Gelegenheiten oder zu hohem Handel führen
- Marktumfeld-Abhängigkeit: Häufige Stop-Loss-Auslöse in unsicheren Märkten
- Schlupfpunkteffekte: Während hoher Schwankungen kann der tatsächliche Handelspreis von den Signalpreisen stark abweichen
- Risikomanagement: Fehlende Positionsmanagement-Mechanismen können zu einer übergroßen Risikolockage führen
Richtung der Strategieoptimierung
- Erhöhung der Trendfilterung: Verbesserte Signalqualität in Kombination mit Trendindikatoren mit längeren Perioden
- Dynamische Parameteroptimierung: automatische Anpassung von Schwankungen und Stop-Loss-Parametern an die Marktschwankungen
- Einführung der Übertragungsbestätigung: Erhöhung der Übertragungsfilterbedingungen und Verbesserung der Durchbruchsicherheit
- Optimierung von Stop-Loss: Dynamische Stop-Loss-Anpassung an unterschiedliche Marktumstände
- Positionsverwaltung hinzufügen: Positionen dynamisch nach Signalstärke und Marktfluktuation anpassen
Zusammenfassen
Es handelt sich um eine vollständig und logisch konzipierte automatisierte Handelsstrategie. Die Strategie ist durch strenge Bedingungenfilterung und Risikokontrolle sehr praktisch. Sie muss jedoch in der Praxis ausreichend getestet und optimiert werden, insbesondere in Bezug auf die Einstellung von Parametern und die Risikokontrolle.
- 1