MACD-EMA mehrperiodisches dynamisches Crossover-quantitatives Handelssystem

Überblick
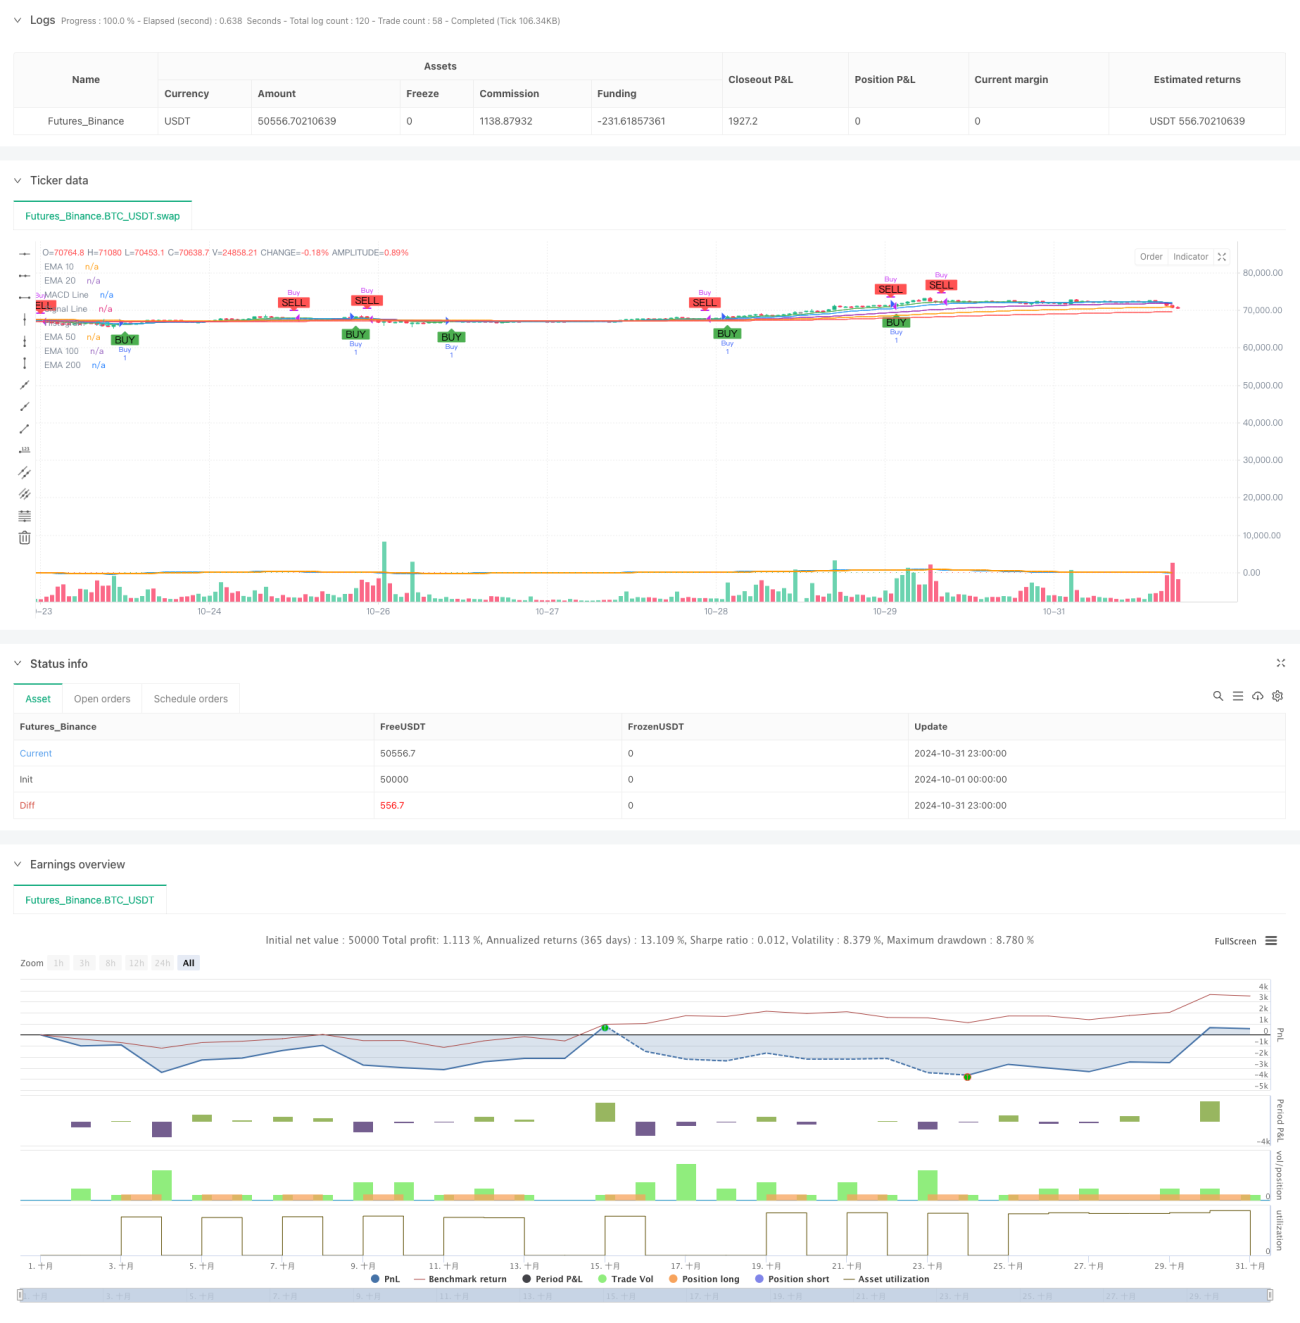
Die Strategie ist ein quantitatives Handelssystem, das auf MACD- und mehrperiodischen EMA-Indikatoren basiert. Die Strategie baut ein vollständiges Handelsentscheidungssystem auf, indem sie die Trend-Tracking-Eigenschaften des MACD-Indikators und die Unterstützungs-Widerstands-Eigenschaften mehrerer EMA-Gleichlinien kombiniert. Das System enthält nicht nur die Generierung von Kauf- und Verkaufssignalen, sondern auch eine integrierte Echtzeit-Vorwarnfunktion, die dem Händler hilft, Marktchancen rechtzeitig zu erfassen.
Strategieprinzip
Die Kernlogik der Strategie basiert auf zwei wichtigen technischen Indikatoren. Erstens ist der MACD-Indikator, der aus einer schnellen Linie (12 Zyklen) und einer langsamen Linie (26 Zyklen) besteht, die ein Handelssignal durch die Kreuzung der beiden Linien erzeugt. Wenn die MACD-Linie die Signallinie überquert, wird ein Kaufsignal erzeugt, wenn sie untergeht, wird ein Verkaufssignal erzeugt.
Strategische Vorteile
- Verbesserte Signalsysteme: Kombination von Trend-Tracking-Funktionen des MACD-Indikators und der Trendbestätigung von mehreren EMAs.
- Multidimensionelle Analyse: Die EMAs bieten mehrere Ebenen der Marktstruktur für die Handelsentscheidung.
- Echtzeit-Warnmechanismus: Echtzeit-Warnmechanismus mit integrierten Kauf- und Verkaufssignalen, der Händlern hilft, Handelsmöglichkeiten rechtzeitig zu erkennen.
- Die Strategie zeigt die Kauf- und Verkaufssignale klar auf den Diagrammen an, um den Händlern ein intuitives Verständnis der Marktentwicklung zu ermöglichen.
- Anpassbarkeit der Parameter: Die Kernparameter können individuell angepasst werden, um sie für unterschiedliche Marktbedingungen zu optimieren.
Strategisches Risiko
- Rückstandsrisiko: Die MACD und EMA gehören zu den Rückstandsindikatoren und können in stark volatilen Märkten zu Signalrückständen führen.
- Gefahr von falschen Durchbrüchen: In der Horizontalen Ordnungsphase kann es zu häufigen falschen Durchbrüchen kommen.
- Trendwechselrisiko: Bei großen Trendwechselpunkten kann die Anpassungsfähigkeit der Strategie nicht ausreichen.
- Parameter-Sensitivität: In unterschiedlichen Marktumgebungen können feste Parameter zu instabilen Effekten führen.
Richtung der Strategieoptimierung
- Einführung von Schwankungsfilter: Es wird empfohlen, Schwankungsindikatoren wie ATR oder Brin-Band hinzuzufügen, um falsche Signale in Umgebungen mit niedriger Schwankung zu filtern.
- Hinzu kommt die Übertragungsbestätigung: Die Übertragungsbestätigung kann mit einem Übertragungsmessgerät kombiniert werden, um die Zuverlässigkeit des Signals zu erhöhen.
- Optimierte Stop-Loss-Mechanismen: Es wird empfohlen, dynamische Stop-Loss-Funktionen wie Tracking-Stops oder Stop-Loss-Einstellungen auf ATR-Basis hinzuzufügen.
- Erhöhung der Klassifizierung der Marktumgebung: Strategieparameter können dynamisch an unterschiedliche Marktumgebungen angepasst werden (Trends/Schock).
- Hinzufügung eines Risikokontrollmoduls: Positionsverwaltung und Risikokontrollfunktionen werden empfohlen.
Zusammenfassen
Die Strategie kombiniert MACD und Multi-Perioden-EMA-Indikatoren, um ein relativ vollständiges Handelssystem zu erstellen. Die Vorteile des Systems liegen in der Signalklarheit, der Analysedimensionalität und der guten Visualisierung. Es gibt jedoch auch die inhärenten Risiken wie Lagerung und Falschsignale.
- 1