
Überblick
Die Strategie ist ein quantitativer Handelssystem, das Bollinger Bands, relativ starke Indikatoren und dynamische Kostenmittel kombiniert. Die Strategie führt automatische Lagerungsoperationen in Schuhen in Marktschwankungen durch, indem sie Geldmanagementregeln festlegt, während sie in Verbindung mit technischen Indikatoren für Kauf- und Verkaufssignale entscheidet, um eine risikokontrollierbare Handelsabwicklung zu ermöglichen. Das System enthält auch Stop-Logik und Cumulative Profit-Tracking-Funktionen, um die Handelsperformance effektiv zu überwachen und zu verwalten.
Strategieprinzip
Die Strategie basiert im Wesentlichen auf den folgenden Kernkomponenten:
- Der Brin-Band-Indikator wird verwendet, um die Bandbreite der Preisschwankungen zu bestimmen, indem er einen Kauf bei der Berührung der unteren Bahn und einen Verkauf bei der Berührung der oberen Bahn berücksichtigt.
- Der RSI-Indikator wird verwendet, um zu bestätigen, dass der Markt überkauft ist, wenn der RSI unter 25 überkauft ist und über 75 überkauft ist.
- Das DCA-Modul berechnet den Betrag für jede Einlage auf Basis der Konto-Zinsdynamik und ermöglicht die adaptive Verwaltung der Mittel.
- Der Stop-Loss-Modul setzt ein Gewinnziel von 5% und erreicht das Ziel der automatischen Geländeabsicherung.
- Marktstatus-Monitoring-Modul berechnet die 90-Tage-Marktveränderungen und hilft, die Gesamttrends zu bestimmen
- Das Modul für die Verfolgung der kumulierten Gewinne zeichnet die Gewinn- und Verlustrechnung für jeden Handel auf, um die Strategie-Performance zu bewerten
Strategische Vorteile
- Signalzuverlässigkeit durch Cross-Verifizierung mit mehreren technischen Kennzahlen
- Dynamisches Positionsmanagement, um die Risiken von festen Positionen zu vermeiden
- Setzen Sie angemessene Stop-Loss-Bedingungen und sperren Sie die Gewinne rechtzeitig ein
- Mit Markttrend-Monitoring-Funktionen, um den Überblick zu behalten
- Gute Gewinn-Tracking-Systeme, um die Strategie zu analysieren
- Die Alarmfunktion ist gut konfiguriert, um Sie in Echtzeit an die Handelsmöglichkeiten zu erinnern.
Strategisches Risiko
- Unbeständige Märkte könnten häufige Signale auslösen, die zu höheren Transaktionskosten führen.
- Der RSI könnte im Trendmarkt zurückbleiben
- Fixed-Percentage-Stopps könnten zu früh aus einem starken Markt aussteigen
- Die DCA-Strategie könnte zu einem größeren Rückzug in einem einseitigen fallenden Markt führen
Zur Bewältigung der Risiken werden folgende Maßnahmen empfohlen:
- Setzen Sie eine maximale Haltbarkeit
- Parameter für die dynamische Anpassung an die Marktschwankungen
- Trendfilter hinzufügen
- Implementierung einer Stufenstop-Strategie
Richtung der Strategieoptimierung
- Dynamische Optimierung der Parameter:
- Die Brin-Band-Parameter können an die Schwankungen angepasst werden.
- RSI-Trenchwerte ändern sich im Marktzyklus
- Der Anteil der DCA-Fonds kann mit der Größe des Kontos angepasst werden
- Signalsysteme werden verstärkt:
- Bestätigung zur Lautstärkeerhöhung
- Hinzufügen von Trendlinenanalysen
- In Kombination mit mehr technischen Kennzahlen
- Die Risiken sind gut kontrolliert:
- Dynamische Verlustminderung
- Hinzufügen von maximaler Zurückziehungssteuerung
- Setzen Sie eine tägliche Verlustgrenze
Zusammenfassen
Die Strategie baut ein relativ vollständiges Handelssystem auf, indem sie die Methoden der technischen Analyse und des Geldmanagements kombiniert. Die Strategie hat den Vorteil, dass sie mehrere Signale erkennt und ein gutes Risikomanagement bietet, muss jedoch in der Praxis ausreichend getestet und optimiert werden. Durch die kontinuierliche Verbesserung der Parameter-Einstellungen und das Hinzufügen von Hilfsindikatoren wird die Strategie eine stabile Leistung im realen Handel erwarten.
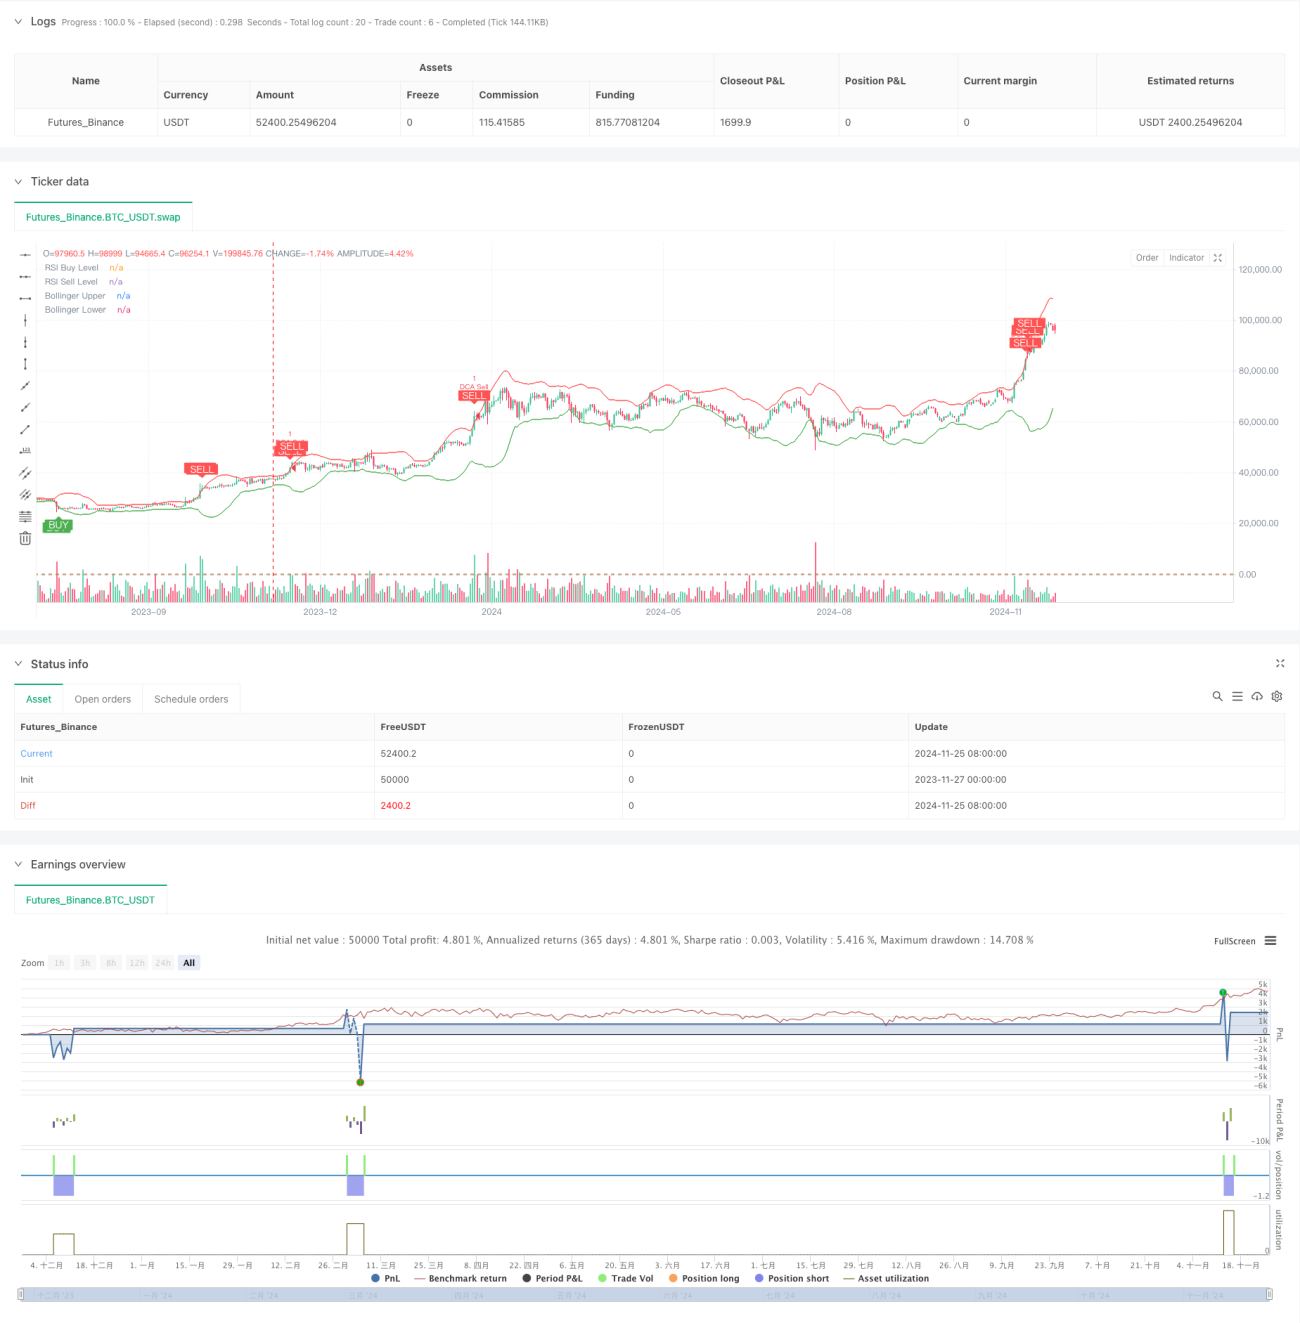
/*backtest
start: 2023-11-27 00:00:00
end: 2024-11-26 00:00:00
period: 1d
basePeriod: 1d
exchanges: [{"eid":"Futures_Binance","currency":"BTC_USDT"}]
*/

//@version=5
strategy("Combined BB RSI with Cumulative Profit, Market Change, and Futures Strategy (DCA)", shorttitle="BB RSI Combined DCA Strategy", overlay=true)

// Input Parameters- 1