Mehrperioden-Trendverfolgung und ATR-Volatilitätsmanagementstrategie

Überblick
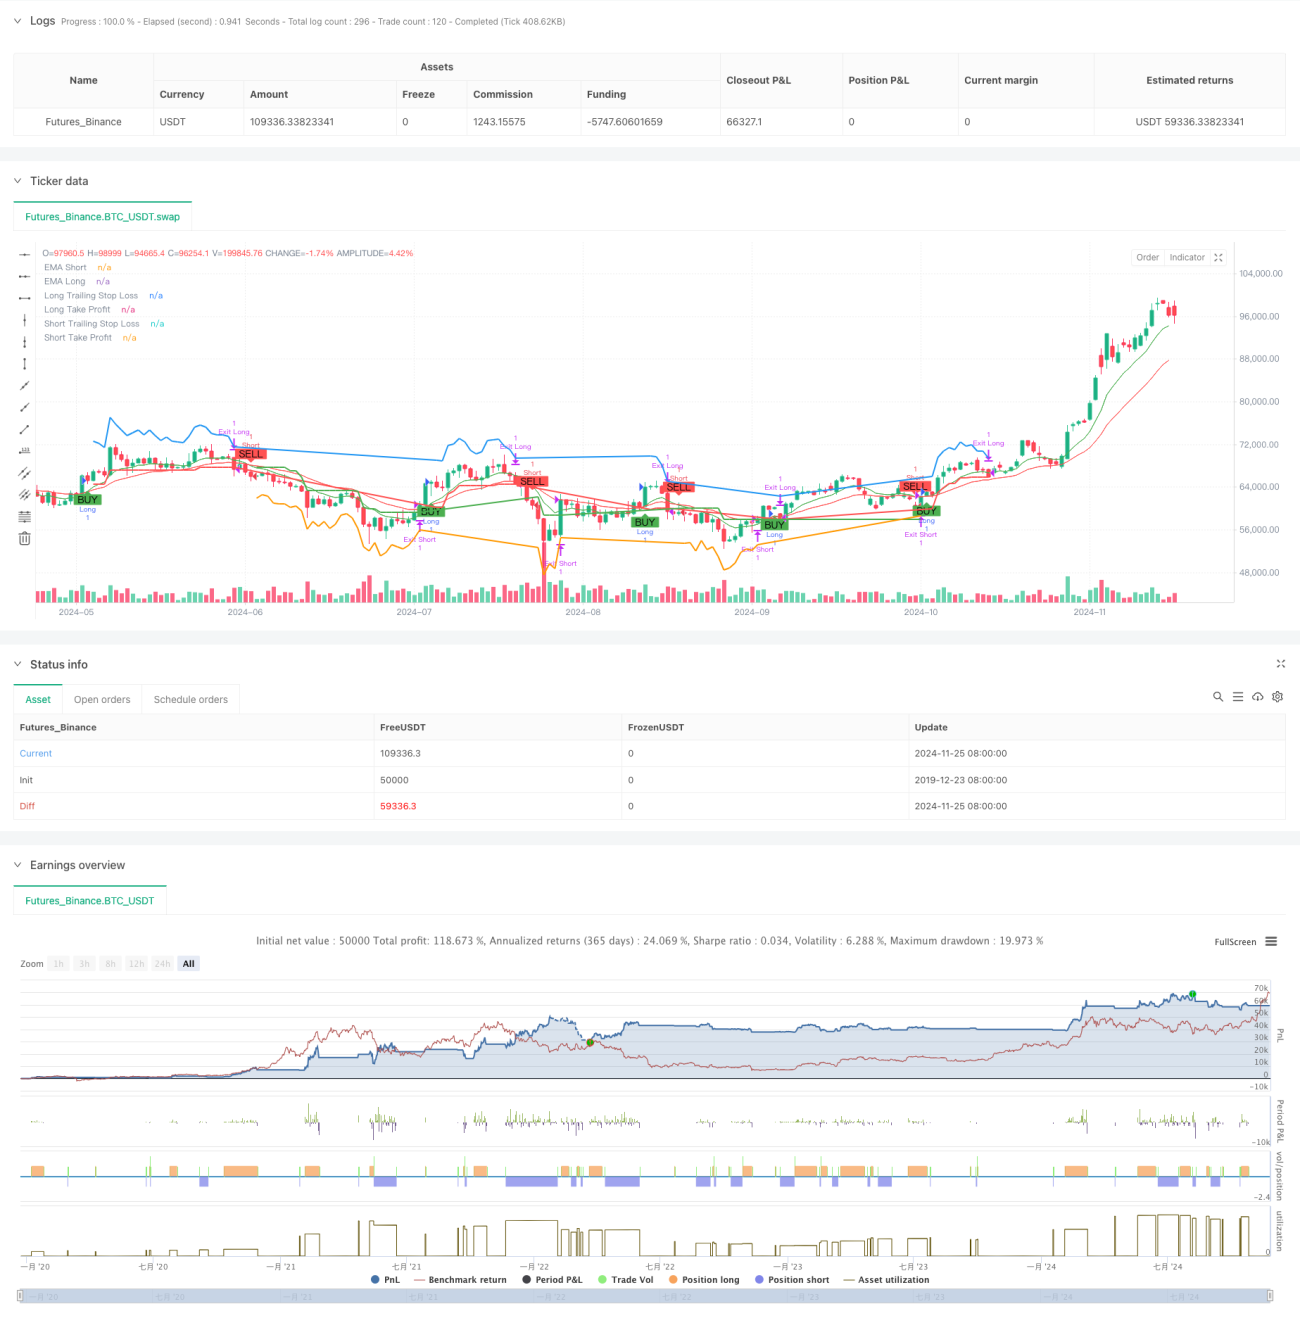
Es handelt sich um eine Trend-Tracking-Strategie, die eine Kombination aus Mehrzyklus-Analyse und Volatilitätsmanagement darstellt. Die Strategie basiert auf einer doppelten Gleichgewichts-Kreuzung der Trendrichtung, einer Überkauf-Überverkauf-Filterung über den RSI-Indikator, einer Bestätigung des Gesamttrends durch die EMA für einen höheren Zeitrahmen und der dynamischen Verwaltung von Stop-Loss- und Gewinnzielen über den ATR-Indikator. Die Strategie gewährleistet durch die Kombination von mehreren technischen Indikatoren sowohl die Zuverlässigkeit der Handelssignale als auch eine effektive Risikokontrolle.
Strategieprinzip
Die Kernlogik der Strategie besteht aus folgenden wichtigen Teilen:
- Trenderkennung: Die Verwendung von Kreuzungen von kurz- und langzeitigen EMAs zur Identifizierung von Trendänderungen, wobei ein Mehrwertsignal beim Überschreiten des kurzfristigen EMAs und ein Fehlwertsignal beim Überschreiten des langfristigen EMAs erzeugt wird.
- Trendbestätigung: Die Einführung von EMAs in höheren Zeiträumen als Trendfilter erlaubt nur, wenn der Preis über den hochperiodischen EMA liegt, mehr zu tun, und umgekehrt, wenn er leer ist.
- Der RSI-Indikator wird verwendet, um Überkauf- und Überverkaufsschätzungen zu treffen und zu verhindern, dass ein übermäßiger Anschlag auf den Absturz eingeleitet wird.
- Positionsmanagement: Stop-Loss- und Profit-Ziele basierend auf dynamischen ATR-Einstellungen, die automatisch die Stop-Loss-Position anpassen, wenn sich der Preis ändert, um sowohl profitabel als auch profitabel zu schützen.
- Mehrdimensionale Absicherung: Strategie, die durch die integrierte Anwendung mehrerer technischer Kennzahlen ein vollständiges System für die Entscheidungsfindung von Transaktionen erstellt.
Strategische Vorteile
- Hohe Signalzuverlässigkeit: Durch die kombinierte Verwendung von mehreren technischen Indikatoren wurde die Zuverlässigkeit der Handelssignale deutlich erhöht.
- Risikokontrolle: Dynamische Stop-Loss-Systeme basierend auf ATR, die die Stop-Loss-Position an die Marktvolatilität anpassen können.
- Trendpräzision: Durch die Verwendung von Mehrzyklus-Analysemethoden wurde die Genauigkeit der Beurteilung der wichtigsten Trends verbessert.
- Die Take-Profit-Einstellung basiert ebenfalls auf der dynamischen Anpassung des ATR, um nicht zu früh aus dem Spiel zu gehen, während gleichzeitig ein Gewinn garantiert wird.
- Anpassungsfähigkeit: Strategieparameter sind anpassungsfähig und können sich an unterschiedliche Marktbedingungen anpassen.
Strategisches Risiko
- Schwankungsrisiko: Häufige Transaktionen können zu Verlusten führen, wenn sich die Börse in einer schwankenden Situation befindet.
- Rutschrisiko: In Zeiten starker Schwankungen können die tatsächlichen Kaufpreise von den theoretischen Preisen stark abweichen.
- Gefahr eines falschen Durchbruchs: Nach einem kurzfristigen Durchbruch kann es zu einem Rückschlag kommen, der zu einem Verlust führt.
- Parameter-Sensitivität: Verschiedene Parameterkombinationen haben einen großen Einfluss auf die Strategie-Performance und müssen ausreichend getestet werden.
Richtung der Strategieoptimierung
- Marktumfelderkennung: Sie können Trendstärke-Indikatoren hinzufügen, um automatisch Positionen zu reduzieren oder den Handel in einem wackligen Markt auszusetzen.
- Optimierung der Eingangszeit: Die Eingangssignale können mit einer Kombination von Verkehrsmesswerten verbessert werden.
- Dynamische Parameter-Anpassung: EMA-Zyklen und ATR-Multiplikatoren können automatisch an die Marktschwankungen angepasst werden.
- Lagerstücksbau in Scherben: Lagerstücksbau in Scherben und Lagerung in Scherben können entworfen werden, um das Risiko eines einzelnen Preispunkts zu verringern.
- Optimierung der Positionsverwaltung: Die Größe der Positionen kann basierend auf dem Konto-Risiko und der Volatilität der Marktdynamik angepasst werden.
Zusammenfassen
Es handelt sich um eine gut entwickelte Trend-Tracking-Strategie, die durch Mehrzyklus-Analyse und Volatilitätsmanagement eine bessere Risiko-Gewinn-Charakteristik erzielt. Die Kernvorteile der Strategie liegen in der organischen Kombination mehrerer technischer Indikatoren, die sowohl die Zuverlässigkeit des Handels als auch die effektive Kontrolle des Risikos gewährleisten. Obwohl einige potenzielle Risiken bestehen, besteht durch kontinuierliche Optimierung und Verbesserung noch Raum für eine Verbesserung der Gesamtperformance der Strategie.
- 1