Erweitertes Dual Moving Average Momentum Trend Following Handelssystem

Die Strategie ist eine dynamische Trend-Tracking-Strategie, basierend auf einem Binary Average-System, das ein Kreuzsignal aus schnellen und langsamen Durchschnittskursen kombiniert und gleichzeitig eine Filterung der Durchschnittskurse einführt, um die Einstiegszeit zu optimieren und durch Kapitalmanagement und Risikokontrolle robuste Handelswirkung zu erzielen.
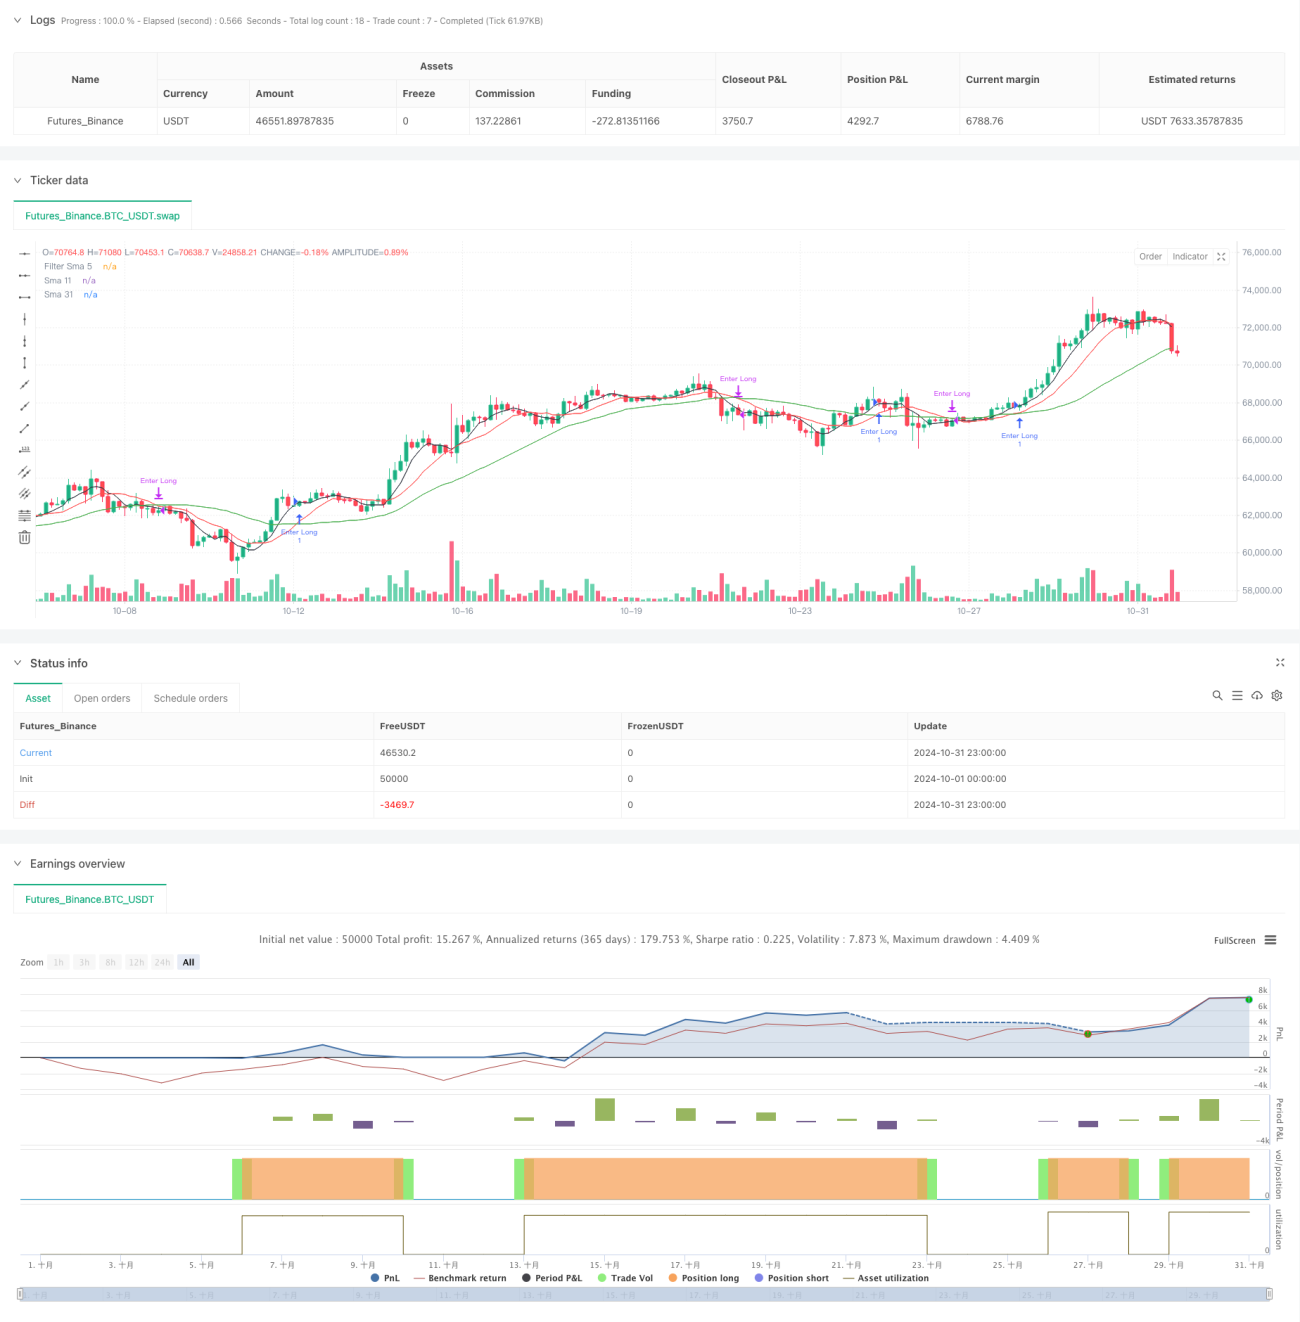
Strategieprinzip
Die Strategie verwendet den einfachen Moving Average (SMA) mit 11 und 31 Zyklen als Hauptsignalsystem und verwendet den 5-Zyklen-Mittelwert als Filter. Wenn der Schnellkurs (SMA11) die langsame Linie (SMA31) durchschreitet und der Preis über der gefilterten Mittelwert liegt, erzeugt das System mehrere Signale. Wenn der Schnellkurs die langsame Linie unterhalb durchschreitet, ist das System ausgeglichen.
Strategische Vorteile
- Signalsysteme sind einfach, klar und leicht zu verstehen und zu implementieren
- Mehrfache Durchschnittlichkeitsbestätigung, um falsche Signale effektiv zu filtern
- Das Risiko ist kontrolliert, wenn man mit einem festen Betrag handelt
- Gute Trends zu verfolgen
- Ein- und Ausstiegslogiken sind klar und lassen keine Entscheidungsunsicherheit zu.
- Anpassung an unterschiedliche Marktbedingungen
Strategisches Risiko
- Schwache Märkte könnten zu häufigen Transaktionen führen
- Das Gleichgewicht hat eine gewisse Rückständigkeit.
- Festag-Trading kann die Kapital-Effizienz nicht voll ausschöpfen
- Veränderungen der Marktschwankungen nicht berücksichtigt
- Das Fehlen von Stop-Loss-Mechanismen könnte zu einem höheren Rücknahmerisiko führen.
Richtung der Strategieoptimierung
- Einführung einer adaptiven, mittellinienartigen Periode, die sich dynamisch an Marktfluktuationen anpasst
- Erhöhung der Volatilitätsfilter, um die Positionen in einem hohen Volatilitätsumfeld anzupassen
- Entwerfen von dynamischen Geldmanagementsystemen, um die Effizienz der Verwendung von Geld zu verbessern
- Ein Stop-Loss- und Stop-Stop-Mechanismus, um das Risiko eines einzelnen Handels zu kontrollieren
- Einführung von Trendstärke-Indikatoren zur Optimierung der Eintrittszeit
- Erhöhung der Zeitfilterung für den Handel und Vermeidung ungünstiger Zeiten
Zusammenfassen
Die Strategie baut ein relativ robustes Trend-Tracking-System auf, das durch ein mehrfaches Gleichgewichtssystem erstellt wird. Obwohl es einige inhärente Einschränkungen gibt, kann die Stabilität und Profitabilität der Strategie durch vernünftige Optimierungen und Verbesserungen weiter verbessert werden.
- 1