T3-Trendverfolgung mit gleitendem Durchschnitt und gleitender Stop-Loss-Strategie für den quantitativen Handel

Überblick
Die Strategie ist ein integriertes quantitatives Handelssystem, das T3-Mittellinien, Trendverfolgung und mobile Stop-Mechanismen kombiniert. Die Strategie identifiziert die Markttrendrichtung über die T3-Moving Average, bestätigt die Signale mit dem Lemon-Trend-Indikator und dem TDFI-Indikator und arbeitet mit einem Risikomanagementsystem zusammen, das mobile Stopps und feste Stopps kombiniert, um Trends zu erfassen und Risiken effektiv zu kontrollieren.
Strategieprinzip
Der Kern der Strategie besteht aus drei Hauptkomponenten: Trenderkennung, Signalbestätigung und Risikomanagement. Erstens wird der T3 Moving Average als wichtigstes Trenderkennungswerkzeug verwendet, wobei der T3 Average durch eine sechseilige Index-Moving Average berechnet wird, um die Lagerung effektiv zu reduzieren und die Gleitlänge zu halten. Zweitens wird der Preisfluktuationsbereich durch den Lemon-Trendindikator berechnet, der in Kombination mit dem TDFI-Indikator gefiltert wird.
Strategische Vorteile
- Der Mechanismus zur Bestätigung mehrerer Signale verbessert die Transaktionsgenauigkeit
- Der Einsatz von T3-Durchschnittslinien reduziert die Auswirkungen von False Breaks
- Flexible Risikomanagement-Systeme, die den Trends genügend Spielraum geben, während sie die Gewinne schützen
- Unterstützung für die Stilllegung von Positionen, um eine schrittweise Einzahlung der Gewinne zu ermöglichen
- Die Parameter sind flexibel und lassen sich leicht an unterschiedliche Marktbedingungen anpassen
Strategisches Risiko
- T3-Durchschnittsrechnung ist kompliziert und kann mit Verzögerungen verbunden sein
- Multiple-Signal-Bestätigung kann zu verpassten Handelschancen führen
- Bewegungsstillstand kann bei starken Schwankungen zu früh ausgelöst werden
- Es sind größere Preisschwankungen erforderlich, um ein wirksames Signal zu erzeugen.
- Häufige Falschsignale auf den OTC-Markt
Richtung der Strategieoptimierung
- Einführung von Volatilitätsindikatoren und Anpassung der beweglichen Stop-Loss-Parameter
- Hinzufügung eines Moduls zur Erkennung von Marktbedingungen, mit unterschiedlichen Parametern für verschiedene Marktbedingungen
- Optimierung der Berechnungszyklen für TDFI-Indikatoren und Verbesserung der Aktualität der Signale
- Signalbestätigung für die Erwägung der Einbeziehung von Transfertfaktoren
- Untersuchungen zur Anpassung an die Mechanismen zur Einstellung der partiellen Stopp-Ratio
Zusammenfassen
Es handelt sich um eine umfassende Trendverfolgungsstrategie, die durch die kombinierte Verwendung von mehreren technischen Indikatoren sowohl die Zuverlässigkeit von Handelssignalen als auch ein effektives Risikomanagement gewährleistet. Die modulare Gestaltung der Strategie bietet gute Skalierbarkeit und Optimierungsmöglichkeiten und eignet sich als Basisrahmen für ein mittelschweres und langfristiges Trendverfolgungssystem. In der Praxis wird empfohlen, die Parameter entsprechend der jeweiligen Handelsvariante und des Marktumfelds zu optimieren.
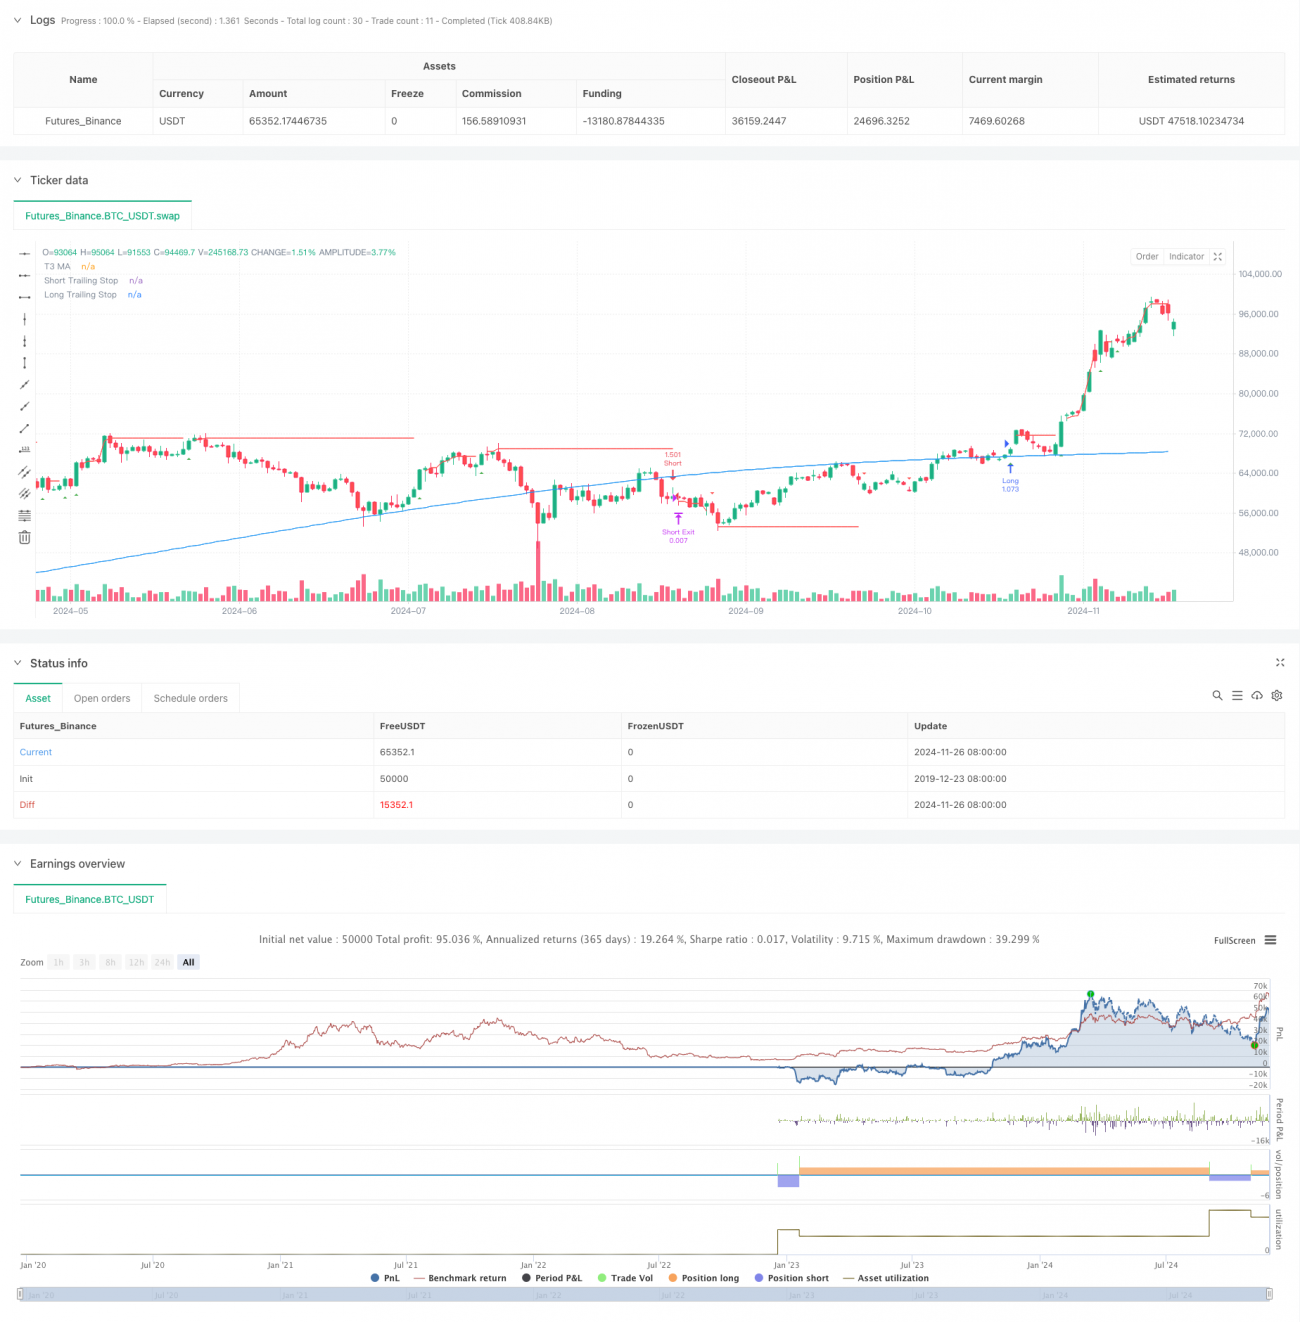
/*backtest
start: 2019-12-23 08:00:00
end: 2024-11-27 00:00:00
period: 1d
basePeriod: 1d
exchanges: [{"eid":"Futures_Binance","currency":"BTC_USDT"}]
*/

//@version=5
strategy("Lemon Trend Strategy", overlay=true, initial_capital=10000, default_qty_type=strategy.percent_of_equity, default_qty_value=100)

// Input parameters- 1