
Überblick
Es handelt sich um eine Trend-Tracking-Strategie, die auf mehrperiodischen Durchschnittslinien-Kreuzungen basiert. Die Strategie beurteilt den Einstiegszeitpunkt hauptsächlich anhand der Kreuzung der 20, 50 und 200-periodischen Index-Moving Averages (EMA) und der Beziehung zwischen dem Preis und der Durchschnittslinie, während die Stop-Loss-Risiken auf Basis von Prozentsätzen eingestellt werden. Die Strategie ist besonders geeignet für größere Zeiträume wie 1-Stunden-, Tages- und Wochenzeitdiagramme und kann mittelfristige und langfristige Trendbewegungen effektiv erfassen.
Strategieprinzip
Die Kernlogik der Strategie basiert auf einem Mehrfach-Gleichgewicht-System und einer Analyse des Preisverhaltens:
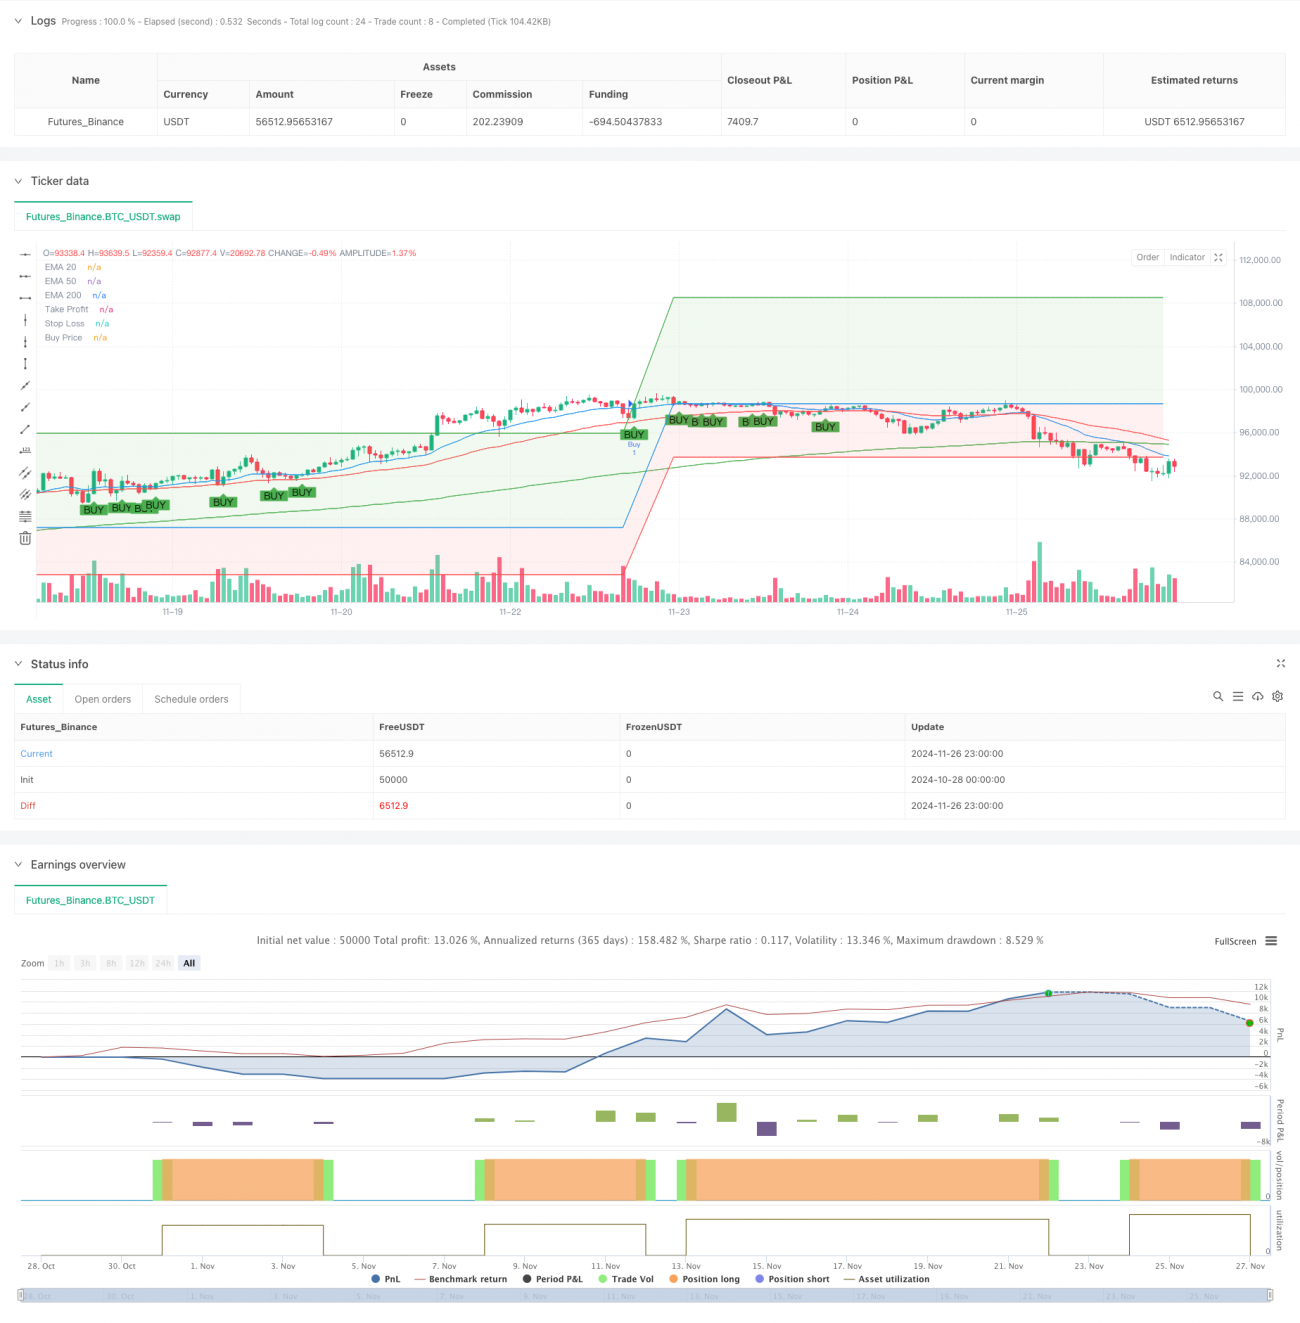
- Trendschätzsysteme mit Indikator-Moving Averages aus drei verschiedenen Perioden (20, 50, 200)
- Die Eintrittsvoraussetzungen sind folgende:
- Der Kurs bricht durch und schließt über der 20-Zyklus-EMA
- Die 20-Zyklus-EMA liegt über der 50-Zyklus-EMA
- Die 50-Zyklus-EMA liegt über der 200-Zyklus-EMA
- Die Risikokontrolle erfolgt auf Basis eines festen Prozentsatzes:
- Der Stop-Stop liegt 10% über dem Einstiegspreis.
- Die Stop-Loss-Einstellung liegt 5% unter dem Einstiegspreis
Strategische Vorteile
- Mehrfache Bestätigungsmechanismen verbessern die Verlässlichkeit
- Multiple Verifizierung durch Triple Average und Price Breakthroughs
- Vermeidung von Falschsignalstörungen
- Gute Risikokontrollsysteme
- Vorinstellung der Stop-Loss-Position
- Das Risiko-Gewinn-Verhältnis ist vernünftig.
- Äußerst anpassungsfähig
- Kann für mehrere Zeitspannen verwendet werden
- Besonders geeignet für den Handel mit mittleren und langen Trends
Strategisches Risiko
- Die Bilanz ist schwach.
- In einem wackligen Markt kann ein Stop-Loss häufig ausgelöst werden.
- Es wird empfohlen, Trends zu verwenden.
- Rückstandsrisiken
- Einheitliche Linien sind etwas rückständig.
- Vielleicht habe ich etwas verpasst.
- Festgeschaltete Stop-Loss-Limit
- Festgelegte Prozentzahlen sind möglicherweise nicht für alle Marktbedingungen geeignet
- Empfehlung zur Anpassung an die Dynamik der Volatilität
Richtung der Strategieoptimierung
- Einführung des Volatilitätsindikators
- Stop-Loss-Anpassung mit ATR
- Steigerung der Marktanpassungsfähigkeit von Strategien
- Zunahme der Trendstärke
- Hinzufügen von Trendstärken wie ADX
- Verbesserung der Eingangssignalqualität
- Optimierung der Durchschnittszyklus
- Anpassung der Mittellinienparameter an die Merkmale des Marktes
- Empfehlungen für die Optimierung der Parameter
Zusammenfassen
Es handelt sich um eine Strategie, die durch die Kombination von mehreren technischen Indikatoren sowohl die Zuverlässigkeit der Strategie als auch eine klare Risikokontrolle gewährleistet. Die Strategie eignet sich besonders für den Betrieb auf großen Periodendiagrammen und bietet einen einzigartigen Vorteil, um mittel- und langfristige Trends zu erfassen. Durch die empfohlene Optimierungsrichtung wird die Strategie weiter verbessert.
- 1