
Überblick
Die Strategie ist ein komplexes Handelssystem, das eine Kombination aus einem zufällig relativ schwachen Index (Stochastic RSI) und einer Pivot-Graphik enthält. Das System analysiert die Überkauf-Überverkauf-Ebene des SRSI-Indikators, kombiniert mit der Pivot-Bestätigung der Preisentwicklung und ermöglicht die vollständig automatisierte Handelssignalgenerierung. Die Strategie verwendet eine fortschrittliche technische Indikatorkombination, kombiniert die Merkmale von Trendverfolgung und Reversal-Trading und ist stark anpassungsfähig.
Strategieprinzip
Die Kernlogik der Strategie basiert auf den folgenden Schlüsselelementen:
- Mit dem 14-Zyklus-RSI als Basis berechnen Sie die zufälligen RSI-Werte, die die Hauptsignalquelle bilden
- K- und D-Linien des zufälligen RSI als einfache Moving Averages mit 3 Perioden für Gleitsignale
- Setzen Sie 80 und 20 als Grenzwerte für Überkauf und Überverkauf, um den Markt zu beurteilen
- Bestätigung der Richtung der Marktentwicklung in Verbindung mit der Beziehung zwischen dem Eröffnungspreis und dem Schlusspreis in der aktuellen Grafik
- Wenn die K-Linie die Übersell-Ebene nach oben überschreitet und die Sonnenstrahlung auftritt, wird ein Mehrsignal ausgelöst.
- Wenn die K-Linie nach unten über die Überkauf-Höhe geht und ein Negativschlag auftritt, wird ein Leerstandssignal ausgelöst
- Ein Stop-Loss in der entsprechenden Richtung, wenn die K-Linie über die Überkauf-Überverkauf-Ebene überschreitet
Strategische Vorteile
- Hohe Signalzuverlässigkeit: Die Genauigkeit der Handelssignale wurde durch die doppelte Bestätigung von Random RSI und Grafiken deutlich verbessert
- Gute Risikokontrolle: Es gibt klare Stop-Loss-Bedingungen, die das Risiko für jeden Handel effektiv kontrollieren
- Anpassbarkeit der Parameter: Die Schlüsselparameter können an unterschiedliche Markteigenschaften angepasst werden
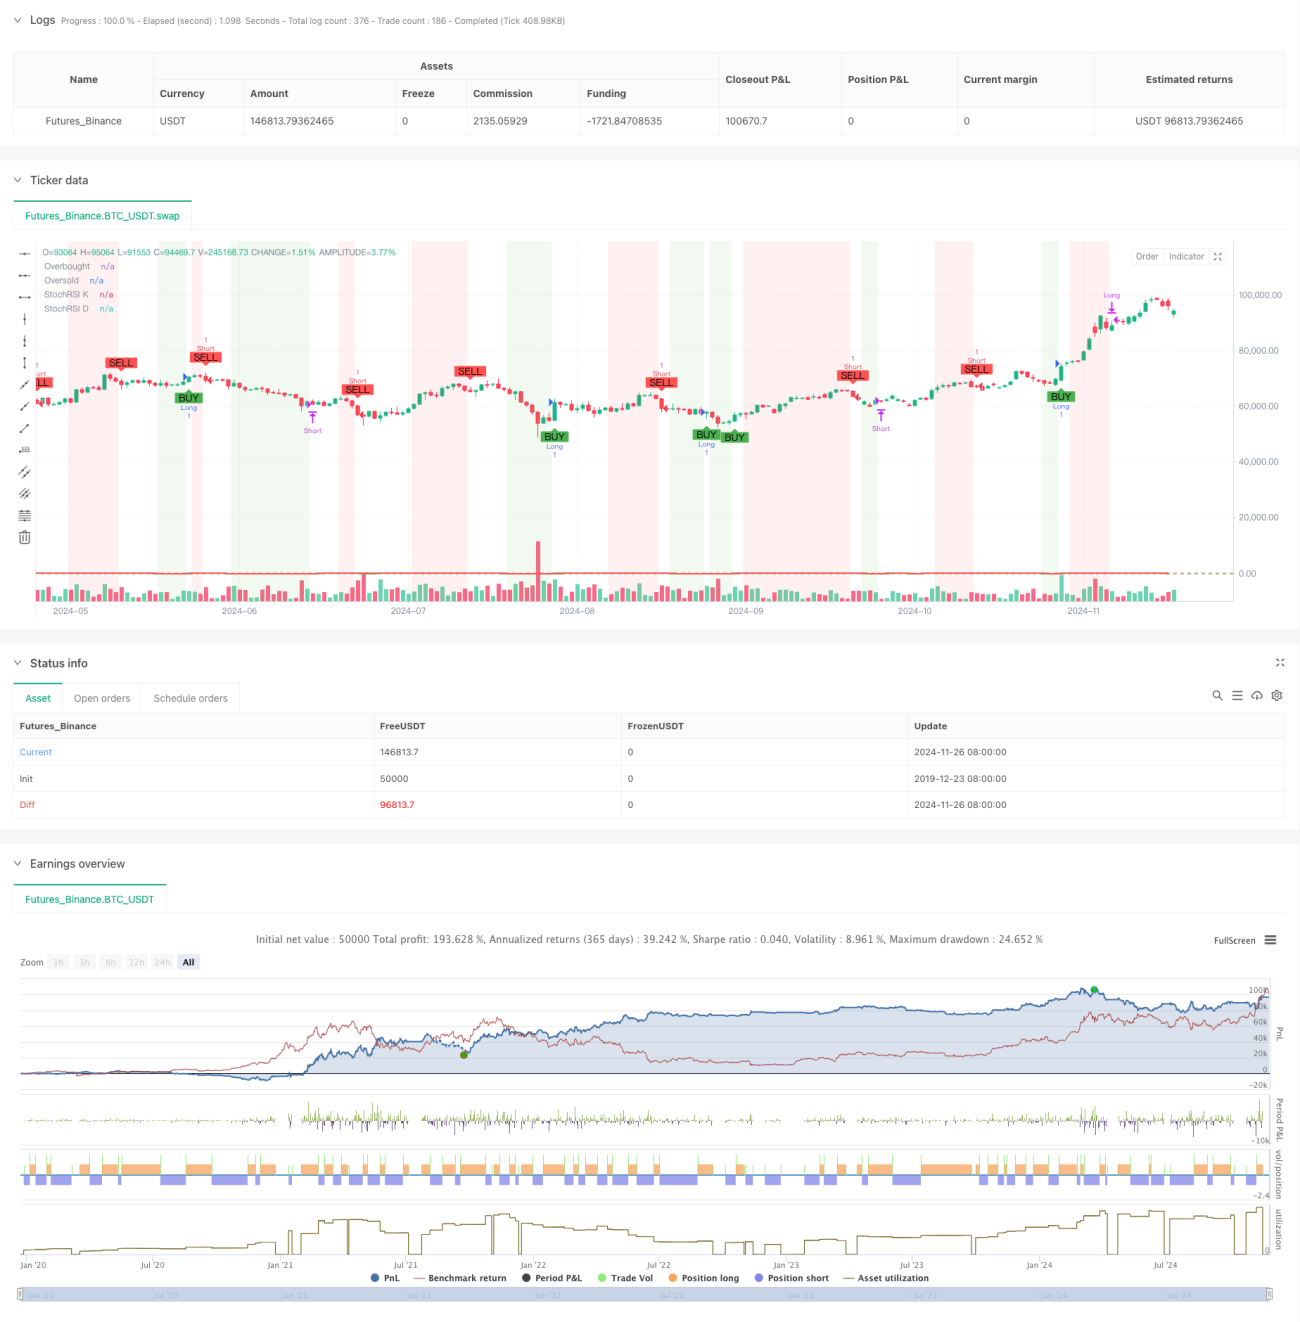
- Klare visuelle Rückmeldung: Verwendung von Hintergrundfarben und Grafikmarkierungen, um die Handelssignale intuitiv anzuzeigen
- Hohe Automatisierungsstufe: Automatisierung des gesamten Prozesses von der Signalgeneration bis zur Auftragsausführung mit geringem menschlichen Eingriff
Strategisches Risiko
- Schwankungsrisiko: Häufige falsche Durchbruchsignale in schwankenden Märkten
- Rückstandsrisiko: Die Berechnung von Moving Averages hat einen gewissen Rückstand und kann den besten Einstiegspunkt verpassen
- Parameter-Sensitivität: Unterschiedliche Parameter-Einstellungen beeinflussen die Strategie-Performance erheblich und erfordern kontinuierliche Optimierung
- Marktumfeld-Abhängigkeit: In einem stark schwankenden Marktumfeld können Signale nicht stabil genug sein
- Systematisches Risiko: Stopps können ausfallen, wenn ein großer Marktereignis eintritt
Richtung der Strategieoptimierung
- Einführung von Umsatzindikatoren: Umsatz kann als zusätzliche Bedingung für die Signalbestätigung erhöht werden
- Optimierte Stop-Loss-Mechanismen: Ein Tracking-Stop oder ein ATR-Dynamic Stop können in Betracht gezogen werden
- Trendfilter hinzufügen: Ein langfristiger Moving Average als Trendfilter
- Verbesserte Signalfilterung: Berücksichtigung von Marktschwankungen und Anpassung der Parameter bei hohen Schwankungen
- Dynamische Parameteranpassung: Dynamische Anpassung der Überkauf-Überverkauf-Schwelle an die Marktlage
Zusammenfassen
Die Strategie baut ein robustes Handelssystem auf, indem sie RSI-Indikatoren mit Zufallsdiagrammen kombiniert. Das System ist einfach zu bedienen und ermöglicht eine gute Risikokontrolle. Die Strategie kann sich an unterschiedliche Marktumgebungen anpassen, indem sie vernünftige Parameteroptimierungen und Signalfilterungen durchführt.
- 1