
Überblick
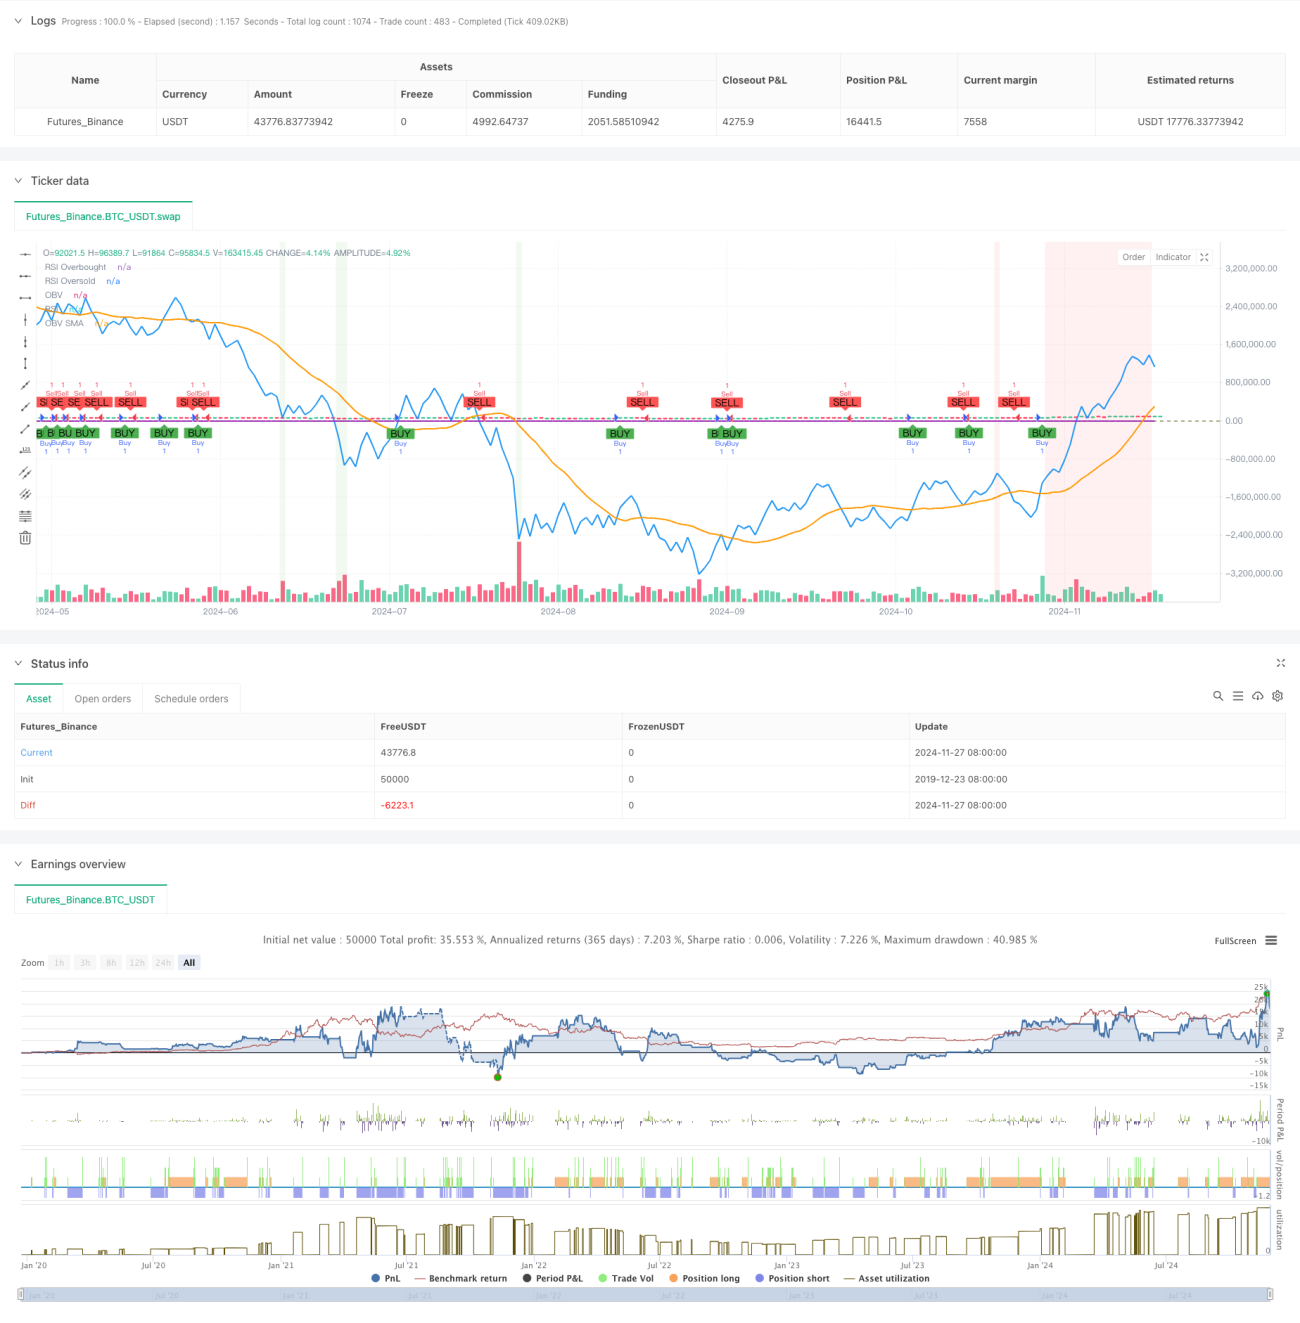
Die Strategie ist ein multidimensionales Momentum-Trading-System, das die Transaktions-Energie-Indikator (OBV), den Moving Average (SMA) und den relativ starken RSI (RSI) kombiniert. Die Strategie erfasst die Marktbewegung durch die Überwachung der Kreuzung des OBV mit seinem Moving Average, während die RSI-Indikator zur Filterung genutzt wird, um eine übermäßige Verfolgung zu vermeiden. Die Strategie integriert auch eine prozentuale Stop-Loss- und Profit-End-Mechanik, um ein ausgewogenes Risikomanagement zu erzielen.
Strategieprinzip
Die Strategie basiert auf drei Dimensionen:
- Der OBV-Indikator wird verwendet, um die Stimmung des Marktes im Hinblick auf die kumulierte Transaktion zu messen, indem er die Richtung der Preisentwicklung und die kumulierte Transaktion berechnet, um die Kauf- und Verkaufskraft des Marktes zu vergleichen.
- Der 20-Perioden-Moving-Average des OBV dient als Referenzlinie. Wenn der OBV den Moving-Average nach oben durchschreitet und der RSI unter 70 liegt, wird ein Mehrsignal ausgelöst. Wenn der OBV den Moving-Average nach unten durchschreitet und der RSI über 30 liegt, wird ein Leersignal ausgelöst.
- Die Einführung des RSI-Indikators als Filter verhindert, dass Positionen in überkauften und überverkauften Bereichen eröffnet werden, was das Risiko eines falschen Durchbruchs reduziert.
Die Strategie verwendet ein festes Prozentsatz Stop-Loss (~ 2%) und Gewinnziel (~ 4%), und dieses symmetrische Risikomanagement-Framework hilft, ein stabiles Gewinn-Risiko-Verhältnis zu halten.
Strategische Vorteile
- Mehrdimensionale Signalbestätigungsmechanismen reduzieren die Auswirkungen von Falschsignalen
- Die organische Kombination von Transaktionsvolumen, Preisdynamik und Überkauf-Überverkaufsindikatoren
- Ein klares Risikomanagement-Framework, feste Stop-Loss- und Gewinnziele
- Die Strategie ist einfach, klar, leicht zu verstehen und zu pflegen.
- Ausgezeichnete visuelle Gestaltung, klare Darstellung von Handelssignalen und Indikatoren
Strategisches Risiko
- Stop-Losses, die bei hoher Volatilität auftreten können
- Ein fester Stop-Loss-Prozentsatz ist möglicherweise nicht für alle Marktbedingungen geeignet.
- Die RSI-Filterbedingungen könnten einige wichtige Trend-Startpunkte verpassen
- OBV-Indikatoren können in einer Umgebung mit geringer Liquidität ein irreführendes Signal erzeugen
- Strategie ohne Berücksichtigung der Auswirkungen der zyklischen Merkmale des Marktes
Richtung der Strategieoptimierung
- Die Einführung von adaptiven Stop-Loss-Mechanismen wie ATR-Stopps oder Stop-Losses mit Schwankungen
- Hinzufügen von Trendfiltern, wie z. B. langfristige Durchschnittslinien, um die Richtung des Haupttrends zu bestimmen
- Optimierung der RSI-Parameter, um die dynamische Anpassung der Überkauf- und Überverkaufsschwellen zu berücksichtigen
- Hinzufügung von Umsatzfilterbedingungen, um sicherzustellen, dass das Signal unter dem Effektivumsatz ausgelöst wird
- Erwägen Sie die Einführung eines Zeitfilters, um schwankende Zeiten zu vermeiden
- Erhöhung der Positionsverwaltung und dynamische Anpassung der Positionen
Zusammenfassen
Es handelt sich um eine vernünftige, multidimensionale, dynamische Handelsstrategie, die durch die Kombination der Vorteile technischer Indikatoren ein vollständiges Handelssystem aufbaut. Die Kernvorteile der Strategie liegen in ihren mehrschichtigen Signalbestätigungsmechanismen und dem normierten Risikomanagement-Framework. Obwohl einige potenzielle Risiken bestehen, kann die Stabilität und Anpassungsfähigkeit der Strategie durch die empfohlene Optimierungsrichtung weiter verbessert werden. Der praktische Wert der Strategie zeigt sich hauptsächlich in der Logik, der Einfachheit der Implementierung und Wartung.
- 1