Dynamische Signallinien-Trendverfolgung und Volatilitätsfilterstrategie

DSL ATR RSI ZLEMA SMA EMA
Erstellungsdatum: 2024-11-29 17:02:33 zuletzt geändert: 2024-11-29 17:02:33
Kopie: 2 Klicks: 502
1
konzentrieren Sie sich auf
1617
Anhänger

Dynamische Signallinien-Trendverfolgung und Volatilitätsfilterstrategie

Überblick

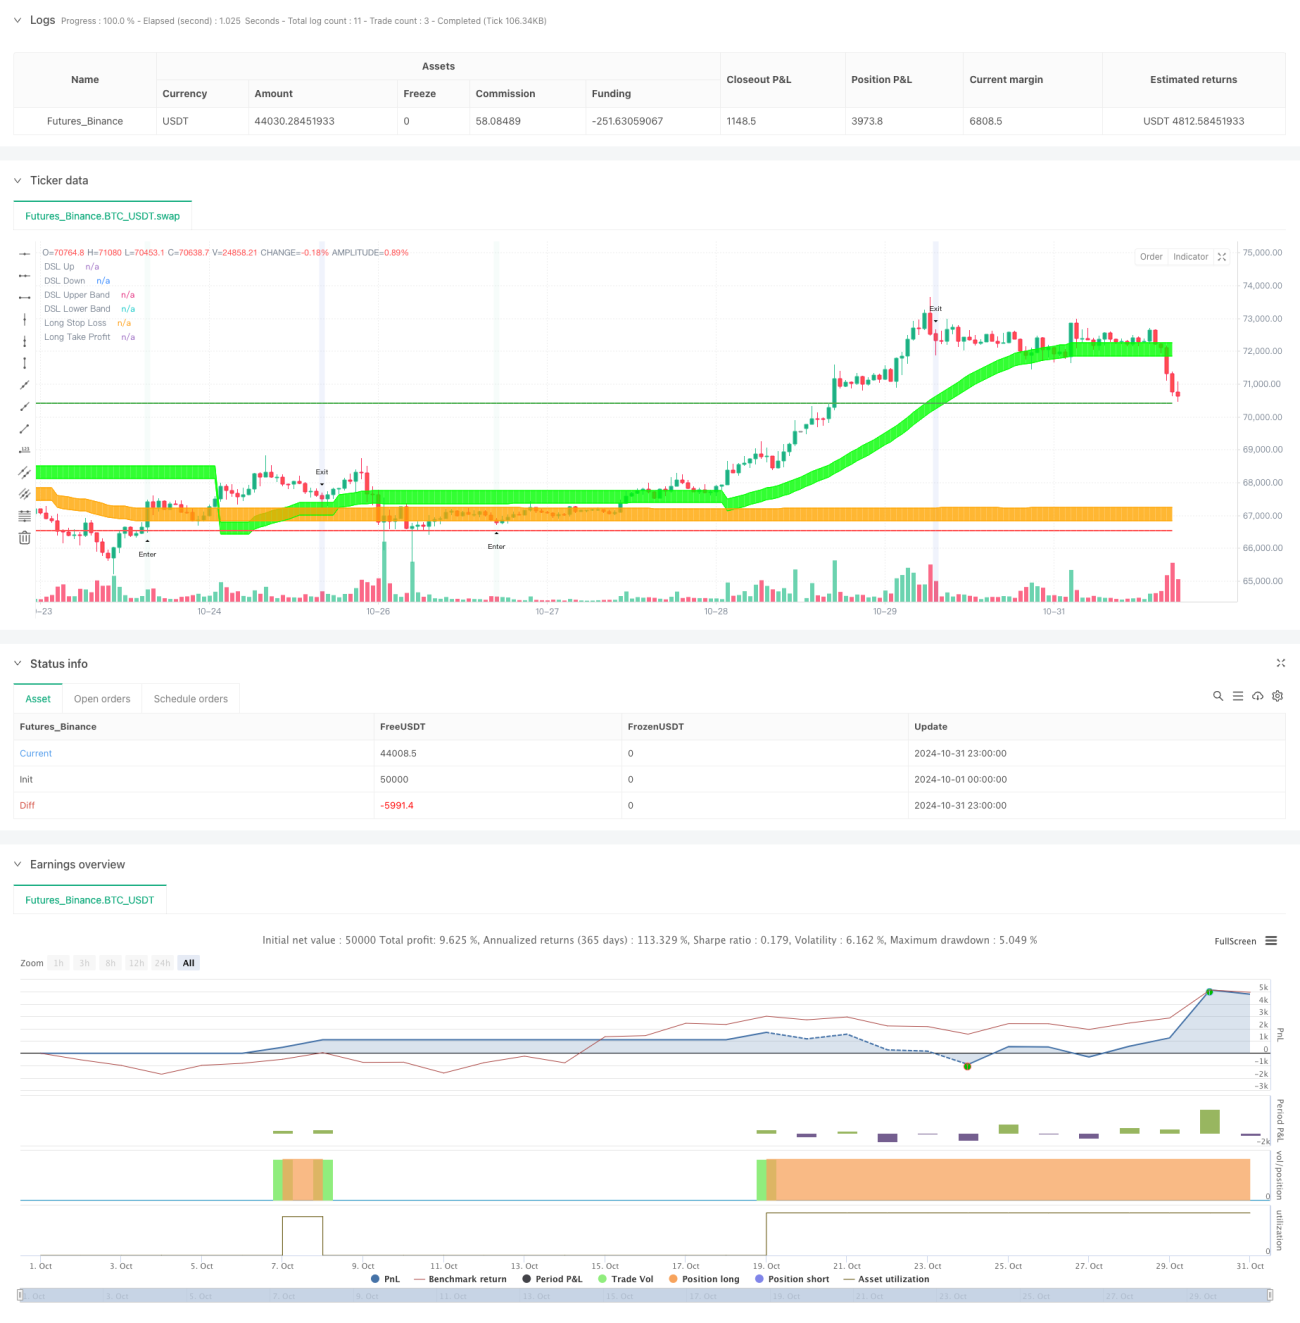
Die Strategie ist ein integriertes Handelssystem, das dynamische Signallinien (DSL), Volatilität und Dynamikindikatoren kombiniert. Die Strategie identifiziert Markttrends effektiv durch dynamische Abschwächungen und eine anpassungsfähige Bandbreite und nutzt Dynamikindikatoren zur Signalfilterung, um exakte Handelszeitpunkte zu erzielen. Das System hat einen vollständigen Risikomanagementmechanismus entwickelt, der eine dynamische Stop-Loss- und eine risikobasierte Gewinnzielstellung beinhaltet.

Strategieprinzip

Die Kernlogik der Strategie basiert auf drei Hauptkomponenten:

Zunächst ist die Dynamic Signal Line System, durch die Berechnung von dynamischen up-und-down-Orbital-Linien auf der Grundlage von Moving Averages. Diese Orbital-Linien werden automatisch angepasst, um die Position auf die jüngsten Höhen und Tiefen des Marktes, um die Selbst-Anpassung an die Trends zu verfolgen.

Die zweite ist ein dynamisches Analyse-System, das einen RSI-Indikator verwendet, der durch den Zero-Latency-Index Moving Average (ZLEMA) optimiert ist. Durch die Anwendung des Konzepts der dynamischen Signallinie auf den RSI kann das System überkaufte und überverkaufte Bereiche genauer erkennen und ein dynamisches Durchbruchsignal erzeugen.

Der dritte ist die Signalintegrationsmechanik. Ein Handelssignal muss gleichzeitig die beiden Bedingungen Trendbestätigung und Dynamikbruch erfüllen, um ausgelöst zu werden. Mehrköpfige Eintritte erfordern, dass der Preis über die Bahn geht und sich oberhalb der Bahn hält, während der RSI die dynamische Signallinie unterhalb durchbricht.

Strategische Vorteile

  1. Anpassungsfähigkeit: Dynamische Signallinien und Bandbreiten passen sich automatisch an die Marktbedingungen an, so dass die Strategie sich an unterschiedliche Marktbedingungen anpassen kann.
  2. False-Signal-Filter: Die Wahrscheinlichkeit von False-Signalen wird signifikant reduziert, indem eine doppelte Bestätigung von Trends und Dynamik gefordert wird.
  3. Gute Risikomanagement: Integration von ATR-basierten dynamischen Stop-Loss- und Risiko-Rendite-basierte Gewinnzielstellung, systematische Risikokontrolle.
  4. Flexibilität und Anpassbarkeit: Strategieparameter können entsprechend unterschiedlicher Märkte und Zeiträume optimiert angepasst werden.

Strategisches Risiko

  1. Trendwechselrisiko: Bei starken Marktwechseln kann die Anpassung der dynamischen Signallinie nicht zeitnah genug sein, was zu einem größeren Rückzug führt.
  2. Oszillationsrisiken: Häufige Durchbrüche können zu mehreren Stop-Losses führen.
  3. Parameter-Sensitivität: Die Strategie ist auf Parameter-Einstellungen empfindlich, und falsche Parameter können die Effektivität der Strategie beeinträchtigen.

Richtung der Strategieoptimierung

  1. Marktumfelderkennung: Marktorganisationen können hinzugefügt werden, um verschiedene Parameter-Einstellungen für verschiedene Marktzustände zu verwenden.
  2. Dynamische Parameteroptimierung: Einführung eines Adaptionsparameter-Anpassungsmechanismus, der automatisch Signallinie- und Bandbreitenparameter entsprechend der Marktvolatilität optimiert.
  3. Multi-Zeit-Perioden-Analyse: Integration von Signalen aus mehreren Zeit-Perioden, um die Zuverlässigkeit von Handelsentscheidungen zu erhöhen.
  4. Anpassung der Volatilität: Anpassung der Stop-Loss-Risiko-Gewinn-Ratio während der hohen Volatilität, um die Risikogewinn-Risiko-Risiko-Risiko der Strategie zu erhöhen.

Zusammenfassen

Die Strategie ermöglicht die effektive Erfassung von Markttrends durch eine innovative Kombination aus dynamischen Signallinien und dynamischen Indikatoren. Die ausgereiften Risikomanagementmechanismen und Signalfiltersysteme machen sie zu einem starken Einsatz in der Praxis. Durch kontinuierliche Optimierung und Parameteranpassung wird die Strategie eine stabile Leistung in verschiedenen Marktumgebungen aufweisen.

Strategiequellcode
/*backtest
start: 2024-10-01 00:00:00
end: 2024-10-31 23:59:59
period: 1h
basePeriod: 1h
exchanges: [{"eid":"Futures_Binance","currency":"BTC_USDT"}]
*/

// This Pine Script™ code is subject to the terms of the Mozilla Public License 2.0 at https://mozilla.org/MPL/2.0/
// © DailyPanda

//@version=5
strategy("DSL Strategy [DailyPanda]",
     initial_capital = 2000,
     commission_value=0.00,
     slippage=3,
     overlay = true)

//--------------------------------------------------------------------------------------------------------------------
// USER INPUTS
//--------------------------------------------------------------------------------------------------------------------

// DSL Indicator Inputs CP
int   len         = input.int(34, "Length", group="CP")      // Length for calculating DSL
int   offset      = input.int(30, "Offset", group="CP")      // Offset for threshold levels
float width       = input.float(1, "Bands Width", step = 0.1, maxval = 2, minval = 0.5, group="CP") // Width for ATR-based bands
float risk_reward = input.float(1.5, "Risk Reward", group="Risk Mgmt") // Risk Reward ratio

// Colors for upper and lower trends
color upper_col = input.color(color.lime, "+", inline = "col")
color lower_col = input.color(color.orange, "-", inline = "col")

// DSL-BELUGA
len_beluga  = input.int(10, "Beluga Length", group="BELUGA")
dsl_mode_inp = input.string("Fast", "DSL Lines Mode", options=["Fast", "Slow"], group="BELUGA")
dsl_mode    = dsl_mode_inp == "Fast" ? 2 : 1

// Colors for DSL-BELUGA
color color_up = #8BD8BD
color color_dn = #436cd3

i_lossPct = input.int(defval=100, title="% max day DD", minval=1, maxval=100, step=1, group="Risk Management")
i_goal = input.bool(title="Enable Daily Goal", defval=false, group="Risk Management")
i_goalPct = input.int(defval=4, title="% Daily Goal", minval=1, step=1, group="Risk Management")


//############################## RISK MANAGEMENT ##############################
// Set maximum intraday loss to our lossPct input
// strategy.risk.max_intraday_loss(i_lossPct, strategy.percent_of_equity)
//strategy.risk.max_intraday_loss(value=1200, type=strategy.cash)

// Store equity value from the beginning of the day
eqFromDayStart = ta.valuewhen(ta.change(dayofweek) > 0, strategy.equity, 0)
// Calculate change of the current equity from the beginning of the current day
eqChgPct = 100 * ((strategy.equity - eqFromDayStart - strategy.openprofit) / (strategy.equity-strategy.openprofit))
f_stopGain = eqChgPct >= i_goalPct and i_goal ? true : false


//--------------------------------------------------------------------------------------------------------------------
// INDICATOR CALCULATIONS
//--------------------------------------------------------------------------------------------------------------------

// Function to calculate DSL lines based on price
dsl_price(float price, int len) =>
    // Initialize DSL lines
    float dsl_up = na
    float dsl_dn = na
    float sma    = ta.sma(price, len)

    // Dynamic upper and lower thresholds calculated with offset
    float threshold_up = ta.highest(len)[offset] 
    float threshold_dn = ta.lowest(len)[offset] 

    // Calculate the DSL upper and lower lines based on price compared to the thresholds
    dsl_up := price > threshold_up ? sma : nz(dsl_up[1]) 
    dsl_dn := price < threshold_dn ? sma : nz(dsl_dn[1])

    // Return both DSL lines
    [dsl_up, dsl_dn]

// Function to calculate DSL bands based on ATR and width multiplier
dsl_bands(float dsl_up, float dsl_dn) =>
    float atr = ta.atr(200) * width // ATR-based calculation for bands
    float upper = dsl_up - atr       // Upper DSL band
    float lower = dsl_dn + atr       // Lower DSL band

    [upper, lower]

// Get DSL values based on the closing price
[dsl_up, dsl_dn] = dsl_price(close, len)

// Calculate the bands around the DSL lines
[dsl_up1, dsl_dn1] = dsl_bands(dsl_up, dsl_dn)


//--------------------------------------------------------------------------------------------------------------------
// DSL-BELUGA INDICATOR CALCULATIONS
//--------------------------------------------------------------------------------------------------------------------

// Calculate RSI with a period of 10
float RSI = ta.rsi(close, 10)

// Zero-Lag Exponential Moving Average function
zlema(src, length) =>
    int   lag      = math.floor((length - 1) / 2)
    float ema_data = 2 * src - src[lag]
    float ema2     = ta.ema(ema_data, length)
    ema2

// Discontinued Signal Lines function
dsl_lines(src, length)=>
    float up  = 0.
    float dn  = 0.
    up := (src > ta.sma(src, length)) ? nz(up[1]) + dsl_mode / length * (src - nz(up[1])) : nz(up[1])  
    dn := (src < ta.sma(src, length)) ? nz(dn[1]) + dsl_mode / length * (src - nz(dn[1])) : nz(dn[1])
    [up, dn]

// Calculate DSL lines for RSI
[lvlu, lvld] = dsl_lines(RSI, len_beluga)

// Calculate DSL oscillator using ZLEMA of the average of upper and lower DSL Lines
float dsl_osc = zlema((lvlu + lvld) / 2, 10)

// Calculate DSL Lines for the oscillator
[level_up, level_dn] = dsl_lines(dsl_osc, 10)

// Detect crossovers for signal generation
bool up_signal = ta.crossover(dsl_osc, level_dn) and dsl_osc < 55
bool dn_signal = ta.crossunder(dsl_osc, level_up) and dsl_osc > 50

//--------------------------------------------------------------------------------------------------------------------
// VISUALIZATION
//--------------------------------------------------------------------------------------------------------------------

// Plot the DSL lines on the chart
plot_dsl_up = plot(dsl_up, color=color.new(upper_col, 80), linewidth=1, title="DSL Up")
plot_dsl_dn = plot(dsl_dn, color=color.new(lower_col, 80), linewidth=1, title="DSL Down")

// Plot the DSL bands
plot_dsl_up1 = plot(dsl_up1, color=color.new(upper_col, 80), linewidth=1, title="DSL Upper Band")
plot_dsl_dn1 = plot(dsl_dn1, color=color.new(lower_col, 80), linewidth=1, title="DSL Lower Band")

// Fill the space between the DSL lines and bands with color
fill(plot_dsl_up, plot_dsl_up1, color=color.new(upper_col, 80))
fill(plot_dsl_dn, plot_dsl_dn1, color=color.new(lower_col, 80))

// Plot signals on the chart
plotshape(up_signal, title="Buy Signal", style=shape.triangleup, location=location.belowbar, size=size.tiny, text="Enter")
plotshape(dn_signal, title="Sell Signal", style=shape.triangledown, location=location.abovebar, size=size.tiny, text="Exit")

// Color the background on signal occurrences
bgcolor(up_signal ? color.new(color_up, 90) : na, title="Up Signal Background", editable = false)
bgcolor(dn_signal ? color.new(color_dn, 90) : na, title="Down Signal Background", editable = false)

//--------------------------------------------------------------------------------------------------------------------
// STRATEGY CONDITIONS AND EXECUTION
//--------------------------------------------------------------------------------------------------------------------

// Variables to hold stop loss and take profit prices
var float long_stop_loss_price  = na
var float long_take_profit_price = na
var float short_stop_loss_price = na
var float short_take_profit_price = na
float pos_size = math.abs(strategy.position_size)

// Long Entry Conditions
bool long_condition1 = not na(dsl_up1) and not na(dsl_dn) and dsl_up1 > dsl_dn
bool long_condition2 = open > dsl_up and close > dsl_up and open[1] > dsl_up and close[1] > dsl_up and open[2] > dsl_up and close[2] > dsl_up
bool long_condition3 = up_signal and pos_size == 0
bool long_condition  = long_condition1 and long_condition2 and long_condition3 and (not f_stopGain)

// Short Entry Conditions
bool short_condition1 = not na(dsl_dn1) and not na(dsl_up) and dsl_dn < dsl_up1
bool short_condition2 = open < dsl_dn1 and close < dsl_dn1 and open[1] < dsl_dn1 and close[1] < dsl_dn1 and open[2] < dsl_dn1 and close[2] < dsl_dn1
bool short_condition3 = dn_signal and pos_size == 0
bool short_condition  = short_condition1 and short_condition2 and short_condition3 and (not f_stopGain)

// Long Trade Execution
if (long_condition and not na(dsl_up1))
    long_stop_loss_price := dsl_up1
    float risk = close - long_stop_loss_price
    if (risk > 0)
        long_take_profit_price := close + risk * risk_reward
        strategy.entry("Long", strategy.long)
        strategy.exit("Exit Long", from_entry="Long", stop=long_stop_loss_price, limit=long_take_profit_price)
else if (strategy.position_size <= 0)
    // Reset when not in a long position
    long_stop_loss_price  := na
    long_take_profit_price := na

// Short Trade Execution
if (short_condition and not na(dsl_dn1))
    short_stop_loss_price := dsl_dn1
    float risk = short_stop_loss_price - close
    if (risk > 0)
        short_take_profit_price := close - risk * risk_reward
        strategy.entry("Short", strategy.short)
        strategy.exit("Exit Short", from_entry="Short", stop=short_stop_loss_price, limit=short_take_profit_price)
else if (strategy.position_size >= 0)
    // Reset when not in a short position
    short_stop_loss_price := na
    short_take_profit_price := na

//--------------------------------------------------------------------------------------------------------------------
// PLOTTING STOP LOSS AND TAKE PROFIT LEVELS
//--------------------------------------------------------------------------------------------------------------------

// Plot the stop loss and take profit levels only when in a position
float plot_long_stop_loss   = strategy.position_size > 0 ? long_stop_loss_price : na
float plot_long_take_profit = strategy.position_size > 0 ? long_take_profit_price : na

float plot_short_stop_loss   = strategy.position_size < 0 ? short_stop_loss_price : na
float plot_short_take_profit = strategy.position_size < 0 ? short_take_profit_price : na

plot(plot_long_stop_loss, title="Long Stop Loss", color=color.red, linewidth=2, style=plot.style_linebr, editable=false)
plot(plot_long_take_profit, title="Long Take Profit", color=color.green, linewidth=2, style=plot.style_linebr, editable=false)

plot(plot_short_stop_loss, title="Short Stop Loss", color=color.red, linewidth=2, style=plot.style_linebr, editable=false)
plot(plot_short_take_profit, title="Short Take Profit", color=color.green, linewidth=2, style=plot.style_linebr, editable=false)