Dynamisches Support-Price-Action-Handelssystem

Überblick
Die Strategie ist ein Handelssystem, das auf Preisbewegungen und dynamischen Unterstützungs- und Widerstandsposten basiert und den Handel durch die Identifizierung von wichtigen Preisformeln in der Nähe von Unterstützungs- und Widerstandspositionen durchführt. Das System verwendet eine 16-Zyklen-Dynamische Unterstützungs- und Widerstandsberechnungsmethode und kombiniert die vier klassischen Reversal-Graphiken - die Rabbit- und Sternenlinie sowie die Kreuz- und Nadel-Graphiken, um potenzielle Marktumkehrchancen zu erfassen. Die Strategie verwendet einen festen Prozentsatz an Stop-Loss-Stopps, um das Risiko zu verwalten, und verwendet Sensitivitätsparameter, um die Strenge des Einstiegssignals zu steuern.
Strategieprinzip
Der Kern der Strategie besteht darin, durch die dynamische Berechnung von Unterstützungs- und Widerstandspunkten eine obere und untere Grenze für die Preisbewegung zu bilden. Wenn die Preise sich diesen kritischen Ebenen nähern, sucht das System nach bestimmten Graphikformationen als Umkehrsignale. Die Einstiegsbedingungen erfordern, dass die Preise in einem Bereich von 1,8% der Unterstützungs- und Widerstandspunkte (default Sensitivität) umgekehrt werden.
Strategische Vorteile
- Die Strategie kombiniert die beiden zuverlässigsten Elemente in der technischen Analyse: Preisform und Unterstützungswiderstand, was die Zuverlässigkeit der Handelssignale erhöht.
- Unterstützungswiderstandspunkte mit dynamischer Berechnung, die sich an veränderte Marktbedingungen anpassen können
- Strenge Mittelmanagement- und Risikokontrollmaßnahmen zur Verhinderung massiver Rücknahmen
- Klare Strategie-Logik mit flexiblen Parametern, die sich an unterschiedliche Marktbedingungen anpassen lassen
- Eintrittssignale sind eindeutig, ohne subjektive Beurteilungselemente, geeignet für automatisierte Transaktionen
Strategisches Risiko
- Die Effektivität von Resistenzstützen kann in einem hochflüchtigen Markt abnehmen
- Die Stop-Loss-Position ist relativ weit entfernt (~16%), kann in extremen Situationen größere Verluste erleiden
- Die Einstellung der Sensitivitätsparameter hat einen wichtigen Einfluss auf die Häufigkeit und Genauigkeit des Handels
- Wenn man sich nur auf die Preisform verlassen würde, könnte man andere wichtige Signale übersehen.
- Die Auswirkungen der Transaktionskosten auf die Strategierendite müssen berücksichtigt werden
Richtung der Strategieoptimierung
- Einführung von Verkehrsvolumen als Hilfsindikator für die Bestätigung und Signalsicherheit
- Entwicklung von adaptiven Sensitivitätsparametern, die sich an dynamische Marktschwankungen anpassen
- Optimierung der Stop-Loss-Einstellungen, Erwägung der Verwendung von mobilen Stop-Loss- oder Phasen-Stop-Systemen
- Trend-Filter hinzugefügt, um Rückschläge in starken Trends zu vermeiden
- Entwicklung eines dynamischen Positionsmanagementsystems, das die Größe des Handels an die Marktlage anpasst
Zusammenfassen
Diese auf dem Preisverhalten basierende Handelsstrategie bietet den Händlern eine systematische Handelsmethode durch die Kombination von dynamischen Unterstützungsresistenzen und klassischen Umkehrformen. Die Vorteile der Strategie liegen in der Logik, der Risikokontrolle, aber die fortlaufende Optimierung basierend auf den tatsächlichen Handelsergebnissen. Der Händler wird empfohlen, vor dem Einsatz in der Praxis ausreichend Rückmeldung und Parameteroptimierung durchzuführen und die Strategie in Verbindung mit Markterfahrung individuell anzupassen.
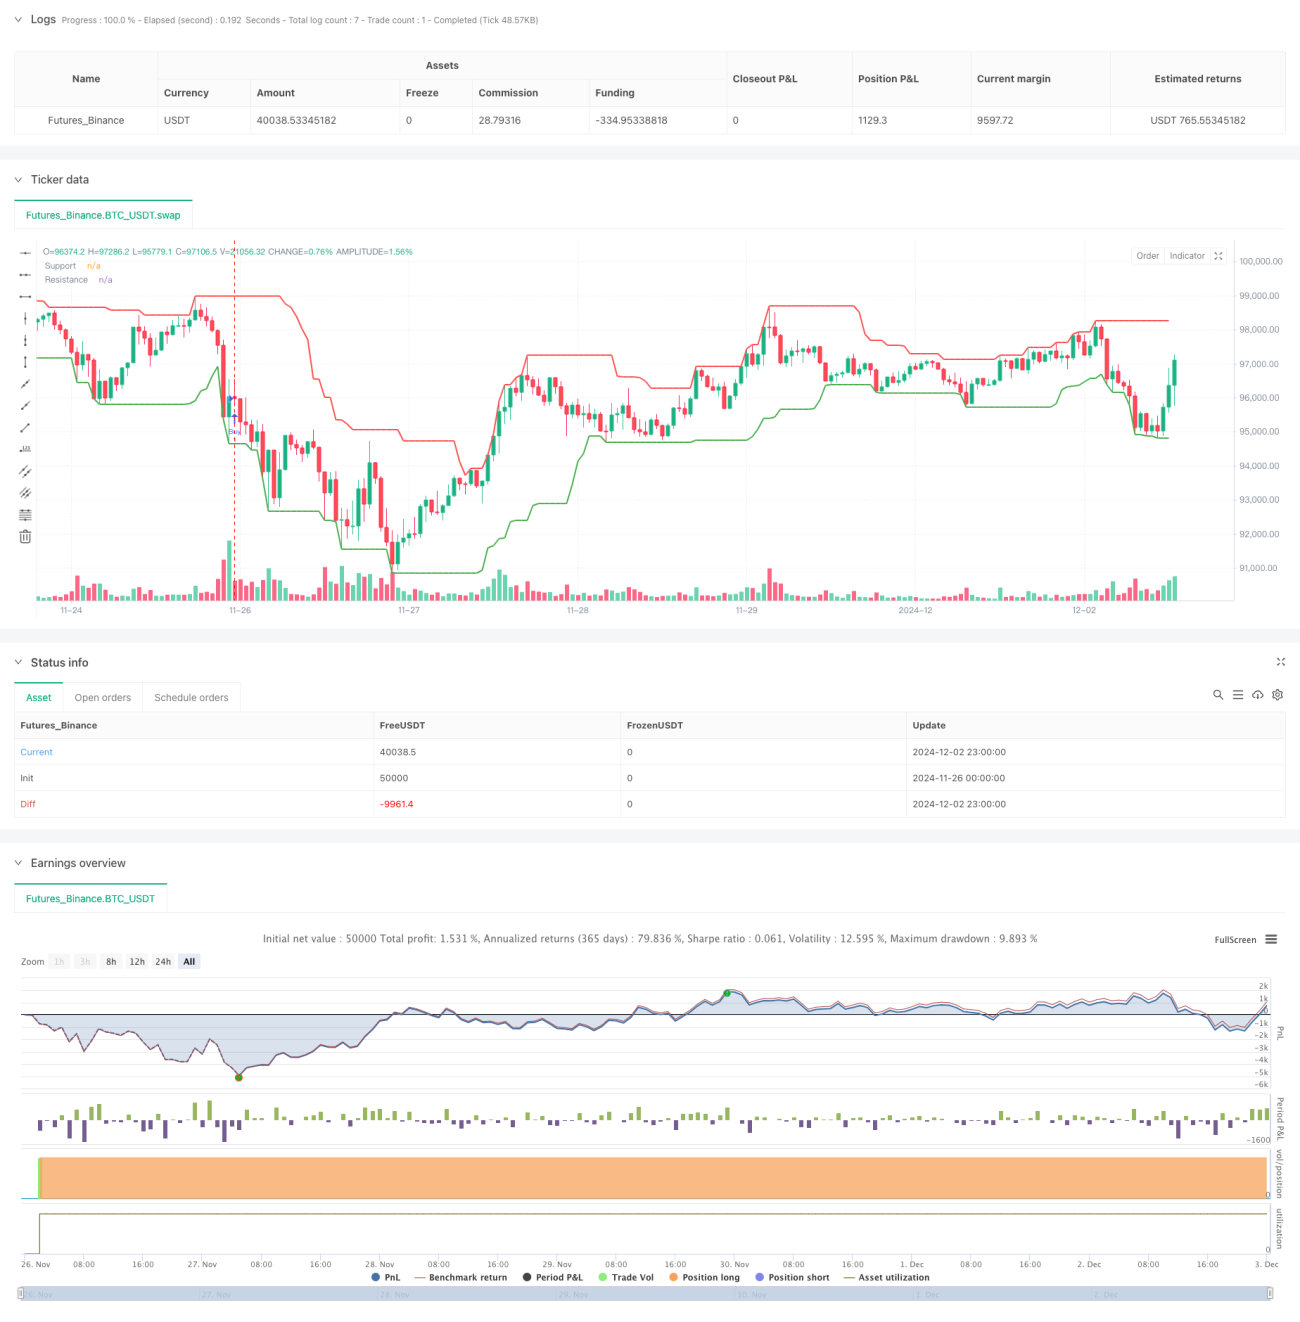
/*backtest
start: 2024-11-26 00:00:00
end: 2024-12-03 00:00:00
period: 1h
basePeriod: 1h
exchanges: [{"eid":"Futures_Binance","currency":"BTC_USDT"}]
*/

// This Pine Script™ code is subject to the terms of the Mozilla Public License 2.0 at https://mozilla.org/MPL/2.0/
// © felipemiransan

//@version=5- 1