Überblick
Die Strategie ist ein integriertes Handelssystem, das ein Doppel-Gleichlinien-System kombiniert, eine Analyse der relativen Schwächen (RSI) und der relativen Stärken (RS). Die Strategie ermöglicht eine mehrdimensionale Handelsentscheidungsmechanismus durch die Bestätigung der Trendbestätigung durch die Kreuzung der 13 und 21 Index Moving Averages (EMA), während die Bestätigung der Handelssignale in Verbindung mit dem RSI und dem RS-Wert im Verhältnis zum Basisindex. Die Strategie enthält auch ein Risiko-Kontrollmechanismus und eine Entscheidung über die Wiedereintrittsbedingungen basierend auf den 52-Wochen-Höhen.
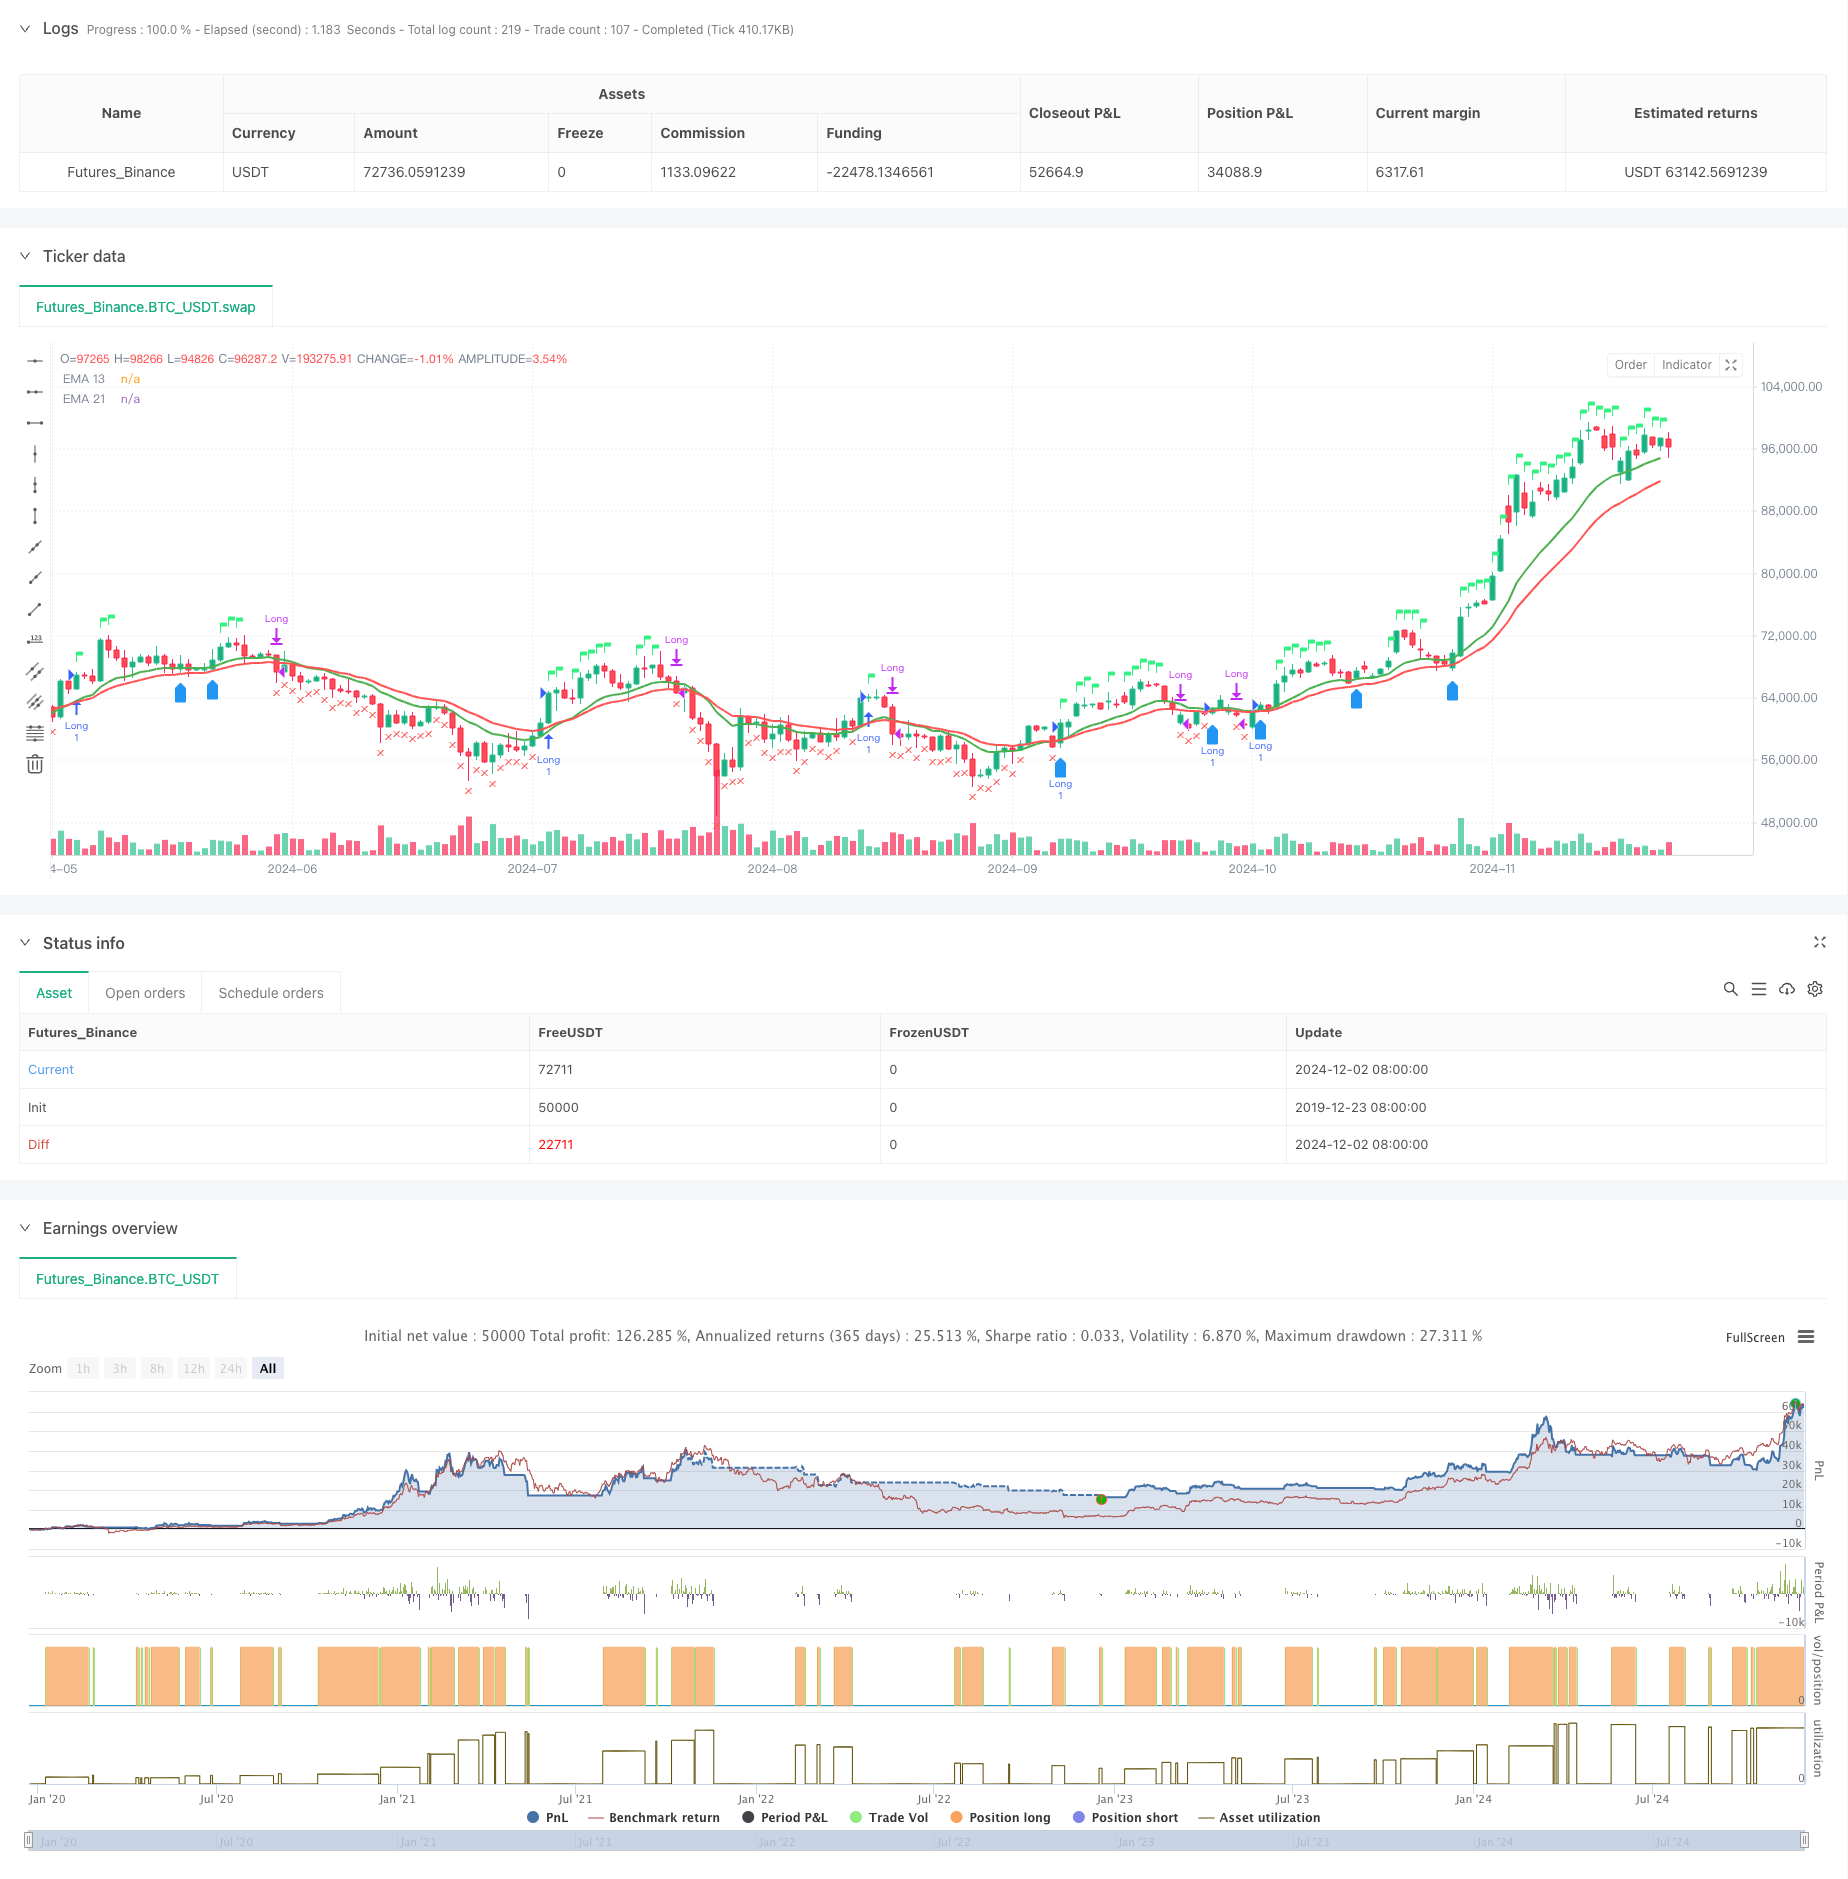
Strategieprinzip
Die Strategie nutzt mehrere Signalbestätigungsmechanismen:
- Die Eingangssignale müssen die folgenden Bedingungen erfüllen:
- EMA13 mit EMA21 oder höher als EMA13
- RSI ist größer als 60
- Relative Intensität (RS) als positive
- Die Bedingungen für den Austritt sind:
- Der Preis fiel unter die EMA21
- RSI unter 50
- RS wird negativ.
- Voraussetzungen für die Wiedereinstieg:
- Die Preise sind höher als EMA13 und EMA13 ist größer als EMA21
- RS bleibt positiv
- Oder die Preise brechen die Höchststände der vergangenen Woche
Strategische Vorteile
- Mehrfache Signalbestätigung reduziert das Risiko einer falschen Einbruchmeldung
- Kombination von Relativitätsanalysen zur effektiven Auswahl von starken Sorten
- Anpassung an die Zeit-Zyklus-Anpassung
- Gute Risikokontrollsysteme
- Ein intelligenter Wiedereintrittsmechanismus
- Die Benutzer können sich über die Benutzung der Software informieren.
Strategisches Risiko
- Schwache Märkte könnten zu häufigen Transaktionen führen
- Die Abhängigkeit von mehreren Indikatoren kann zu Signalverzögerungen führen
- Der festgelegte RSI-Termine ist möglicherweise nicht für alle Marktbedingungen geeignet.
- Die Genauigkeit der Berechnung der relativen Intensität hängt von den Benchmarks ab
- 52-Wochen-Höchststop könnte zu locker sein
Richtung der Strategieoptimierung
- Einführung eines angepassten RSI-Thresholds
- Optimierung der Entscheidungslogik für Wiedereintrittsbedingungen
- Erhöhung der Dimension der Analyse von Transaktionen
- Verbessern Sie den Stop-Profit- und Stop-Loss-Mechanismus
- Schwingungsratefilter hinzufügen
- Optimierung der Relativintensitätsberechnungszyklen
Zusammenfassen
Die Strategie baut ein umfassendes Handelssystem auf, das durch die Kombination von Technischer Analyse und Relative-Strength-Analyse aufgebaut wird. Ihre mehrfache Signalbestätigungsmechanismen und Risikokontrollsysteme machen sie stark praktisch. Durch die empfohlene Optimierungsrichtung gibt es noch Raum für weitere Steigerung der Strategie.
/*backtest
start: 2019-12-23 08:00:00
end: 2024-12-03 00:00:00
period: 1d
basePeriod: 1d
exchanges: [{"eid":"Futures_Binance","currency":"BTC_USDT"}]
*/

//@version=5
strategy("EMA 13 & 21 Entry Exit", overlay=true)

// Define the EMAs
ema13 = ta.ema(close, 13)
ema21 = ta.ema(close, 21)

// Define the RSI
rsi = ta.rsi(close, 14)

// Calculate the closing price relative to Nifty 50
//nifty50 = request.security("NSE:NIFTY", timeframe.period, close)
//closeRelative = close / nifty50

// Define a base period (e.g., 123) and adjust it based on the timeframe
//basePeriod = 123

// Calculate the effective period based on the timeframe
//effectivePeriod = basePeriod * (timeframe.isintraday ? (60 / timeframe.multiplier) : 1)

// Calculate the EMA
//rs = ta.ema(closeRelative, effectivePeriod)

// Define the Relative Strength with respect to NIFTY 50
nifty50 = request.security("swap", "D", close)
rs = ta.ema(close / nifty50, 55 )

// Define the previous 2-week low and last week's high
twoWeekLow = ta.lowest(low, 10)  // 10 trading days roughly equal to 2 weeks
lastWeekHigh = ta.highest(high, 5)  // 5 trading days roughly equal to 1 week
fiftytwoWeekhigh = ta.highest(high, 52*5) // 252 tradingdays roughly equal to 52 week.

// Long condition: EMA 21 crossing above EMA 55, price above EMA 21, RSI > 50, and RS > 0
longCondition = ta.crossover(ema13, ema21) or close > ema13 and rsi > 60 and rs > 0

// Exit condition: Price closing below EMA 55 or below the previous 2-week low
exitCondition = close < ema21 or rsi < 50 or rs < 0 //or close < fiftytwoWeekhigh*0.80

// Re-entry condition: Price crossing above EMA 21 after an exit, EMA 21 > EMA 55, and RS > 1
reEntryCondition = ta.crossover(close, ema13) and ema13 > ema21 and rs > 0

// Re-entry condition if trailing stop loss is hit: Price crossing above last week's high
reEntryAfterSL = ta.crossover(close, lastWeekHigh)

// Plot the EMAs
plot(ema13 ,color=color.green, title="EMA 13",linewidth = 2)
plot(ema21, color=color.red, title="EMA 21",linewidth = 2)


// Plot buy and sell signals
plotshape(series=longCondition, location=location.abovebar, color=color.rgb(50, 243, 130), style=shape.flag, title="Buy Signal")
plotshape(series=exitCondition, location=location.belowbar, color=color.red, style=shape.xcross, title="Sell Signal")
plotshape(series=reEntryCondition or reEntryAfterSL, location=location.belowbar, color=color.blue, style=shape.labelup, title="Re-entry Signal")
//plotshape(series = fiftytwoWeekhigh,location=location.abovebar, color=color.blue,style=shape.flag, title="52WH")

// Plot background color for RS > 0
//bgcolor(rs > 0 ? color.new(color.green, 90) : na, title="RS Positive Background")
// Plot the previous 2-week low and last week's high
// plot(twoWeekLow, color=color.orange, title="2-Week Low")
// plot(lastWeekHigh, color=color.purple, title="Last Week High")

// Strategy logic
if (longCondition or reEntryCondition or reEntryAfterSL)
    strategy.entry("Long", strategy.long)

if (exitCondition)
    strategy.close("Long")

 // Calculate Stop Loss (SL) and Profit
var float entryPrice = na
var float stopLoss = na
var float profit = na

if (strategy.opentrades > 0)
    entryPrice := strategy.opentrades.entry_price(strategy.opentrades - 1)
    stopLoss := fiftytwoWeekhigh * 0.80
    profit := (close - entryPrice) / entryPrice * 100

// Display the strategy table
var table strategyTable = table.new(position.top_right, 4, 2, border_width = 1)

// Make the table movable
tableX = input.int(0, title="Table X Position")
tableY = input.int(0, title="Table Y Position")

// Add size options for the table
tableSize = input.string("small", title="Table Size", options=["tiny", "small", "large"])

// Adjust table size based on user input
tableWidth = tableSize == "tiny" ? 2 : tableSize == "small" ? 4 : 6
tableHeight = tableSize == "tiny" ? 1 : tableSize == "small" ? 2 : 3

// Create the table with the specified size
//table = table.new(position.top_right, tableWidth, tableHeight, border_width = 1)

// Position the table based on user input
// table.cell(strategyTable, tableX, tableY, "Entry Price",  bgcolor=#18eef9)
// table.cell(strategyTable, tableX, tableY + 1, str.tostring(entryPrice, format.mintick), bgcolor=#18eef9)
// table.cell(strategyTable, tableX + 1, tableY, "Stop Loss (20%)", bgcolor=color.red)
// table.cell(strategyTable, tableX + 1, tableY + 1, str.tostring(stopLoss, format.mintick), bgcolor=color.red)
// table.cell(strategyTable, tableX + 2, tableY, "Profit (%)", bgcolor=color.green)
// table.cell(strategyTable, tableX + 2, tableY + 1, str.tostring(profit, format.percent), bgcolor=color.green)