Fünf gleitende Durchschnitte RSI Trend Tracking Dynamisches Kanal-Handelssystem

Überblick
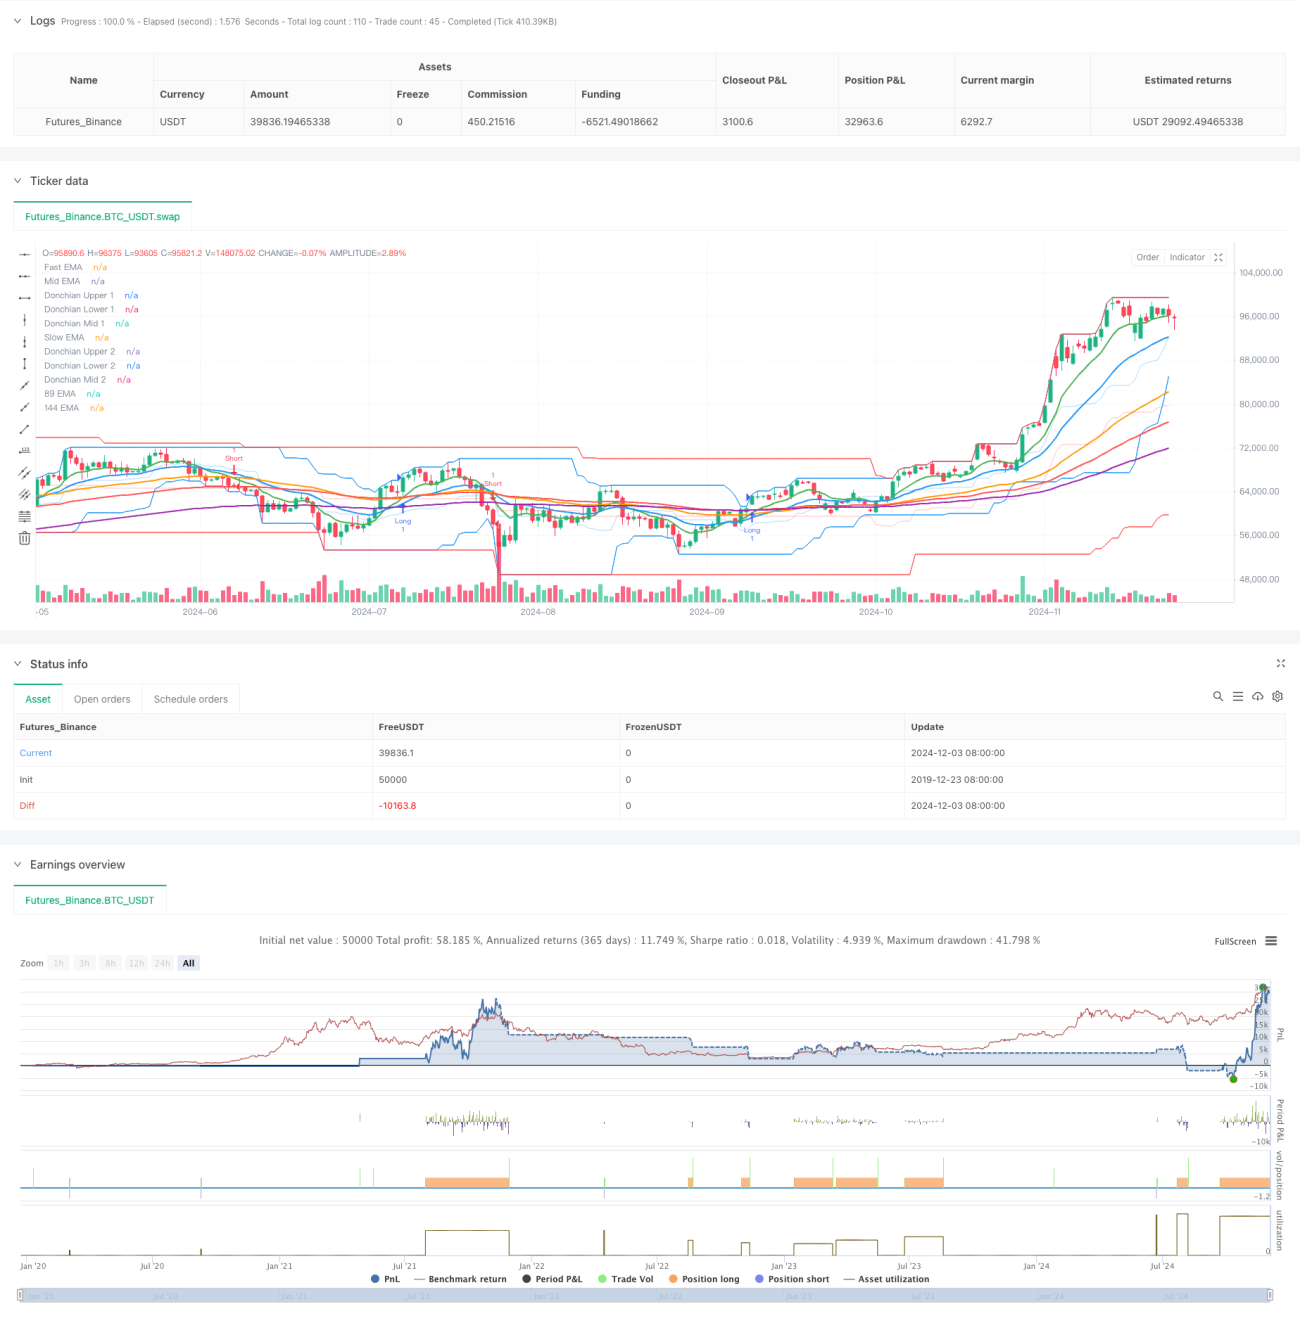
Die Strategie ist ein Trend-Tracking-System, das mehrere technische Indikatoren kombiniert, hauptsächlich aus fünf verschiedenen Perioden, einem Index-Moving Average (EMA), einem relativ starken Indikator (RSI) und zwei verschiedenen Perioden, einem Donchian-Kanal (Donchian Channel). Das System erfasst Markttrends durch die Kombination mehrerer Indikatoren und verwendet dynamische Stop-Loss- und Gewinnziele, um Risiken und Gewinne zu verwalten.
Strategieprinzip
Die Strategie verwendet mehrere Schichten von technischen Indikatoren für die Signalbestätigung: Zuerst wird ein Trendrahmen mit 5 EMAs ((9, 21, 55, 89, 144 Zyklen) erstellt, um eine anfängliche Trendrichtung durch eine Kreuzung von schnellen EMAs und langsamen EMAs zu bestimmen. Zweitens wird der RSI ((Zyklen 14) als Trendfilter verwendet, der den RSI in der Überkaufzone (über 60) und in der Überverkaufszone (unter 40) erlaubt, mehr zu tun.
Strategische Vorteile
- Mehrfache technische Kennzahlen, um die Signalsicherheit zu verbessern
- Die Kombination von Trend-Tracking und Dynamik-Indikatoren ermöglicht eine gute Performance in einem Trendmarkt.
- Die Verwendung von dynamischen Stop-Loss- und Multiple-Profit-Zielen schützt das Geld und nutzt Trends
- Filtersignale durch den RSI zur Verringerung von Falschsignalen bei der Bilanzierung
- Ein hoher Grad an Automatisierung reduziert die emotionalen Auswirkungen menschlicher Eingriffe
Strategisches Risiko
- Mehrere Indikatoren können zu Signalverzögerungen führen, die zu einem größeren Rückzug in einem schnell wechselnden Markt führen können
- RSI-Filter könnten wichtige Trendpunkte übersehen
- Die Einstellung eines festen Prozentsatzes für Stop-Loss und Gewinn ist möglicherweise nicht für alle Marktbedingungen geeignet.
- In hochschwankenden Märkten kann ein Stop-Loss häufig erreicht werden
- Zu viele technische Kennzahlen können zu einer Überoptimierung führen
Richtung der Strategieoptimierung
- Einführung von adaptiven Indikatorparametern, die sich dynamisch an Marktfluktuationen anpassen
- Lautstärkeanzeige als Zusatzbestätigung hinzufügen
- Entwicklung von flexibleren Stop-Systemen wie Tracking-Stops oder ATR-basierten dynamischen Stops
- Einzug in die Identifizierungsmechanismen für die Marktumgebung, mit unterschiedlichen Parameter-Einstellungen für verschiedene Marktbedingungen
- Erwägen Sie, einen Zeitfilter zu verwenden, um zu vermeiden, dass Sie zu unpassenden Zeiten handeln.
Zusammenfassen
Die Strategie baut durch die Kombination von mehreren technischen Indikatoren ein relativ vollständiges Handelssystem auf. Obwohl es eine gewisse Rückständigkeit gibt, ist es durch strenge Signalfilterung und Risikomanagement möglich, stabile Erträge in einem Trendmarkt zu erzielen. Der Händler wird empfohlen, die Parameter in der praktischen Anwendung entsprechend den spezifischen Markteigenschaften und seiner eigenen Risikobereitschaft entsprechend anzupassen.
- 1