Dreiecksausbruch kombiniert mit RSI-Momentum-Strategie

Überblick
Die Strategie ist ein quantitatives Handelssystem, das auf einer Kombination von Preisformeln und technischen Indikatoren basiert. Es wird hauptsächlich durch die Identifizierung von Durchbrüchen in Dreieckformeln und die Dynamikbestätigung in Verbindung mit dem RSI-Indikator gehandelt.
Strategieprinzip
Die Kernlogik der Strategie besteht aus zwei Hauptteilen: Triangle-Form-Erkennung und RSI-Dynamik-Bestätigung. Zuerst wird die Höhe und Tiefe der letzten N-Zyklen mit Hilfe einer linearen Regression berechnet, um eine Auf- und Abwärts-Trendlinie zu bilden, die ein Dreieck bildet.
Strategische Vorteile
- Klarheit der Struktur: Die Strategie kombiniert morphologische und dynamische Analysen, um die Zuverlässigkeit von Transaktionen durch doppelte Bestätigung zu erhöhen.
- Parameterflexibilität: Anpassbare Dreiecklänge und RSI-Zyklusparameter zur Optimierung für verschiedene Marktmerkmale.
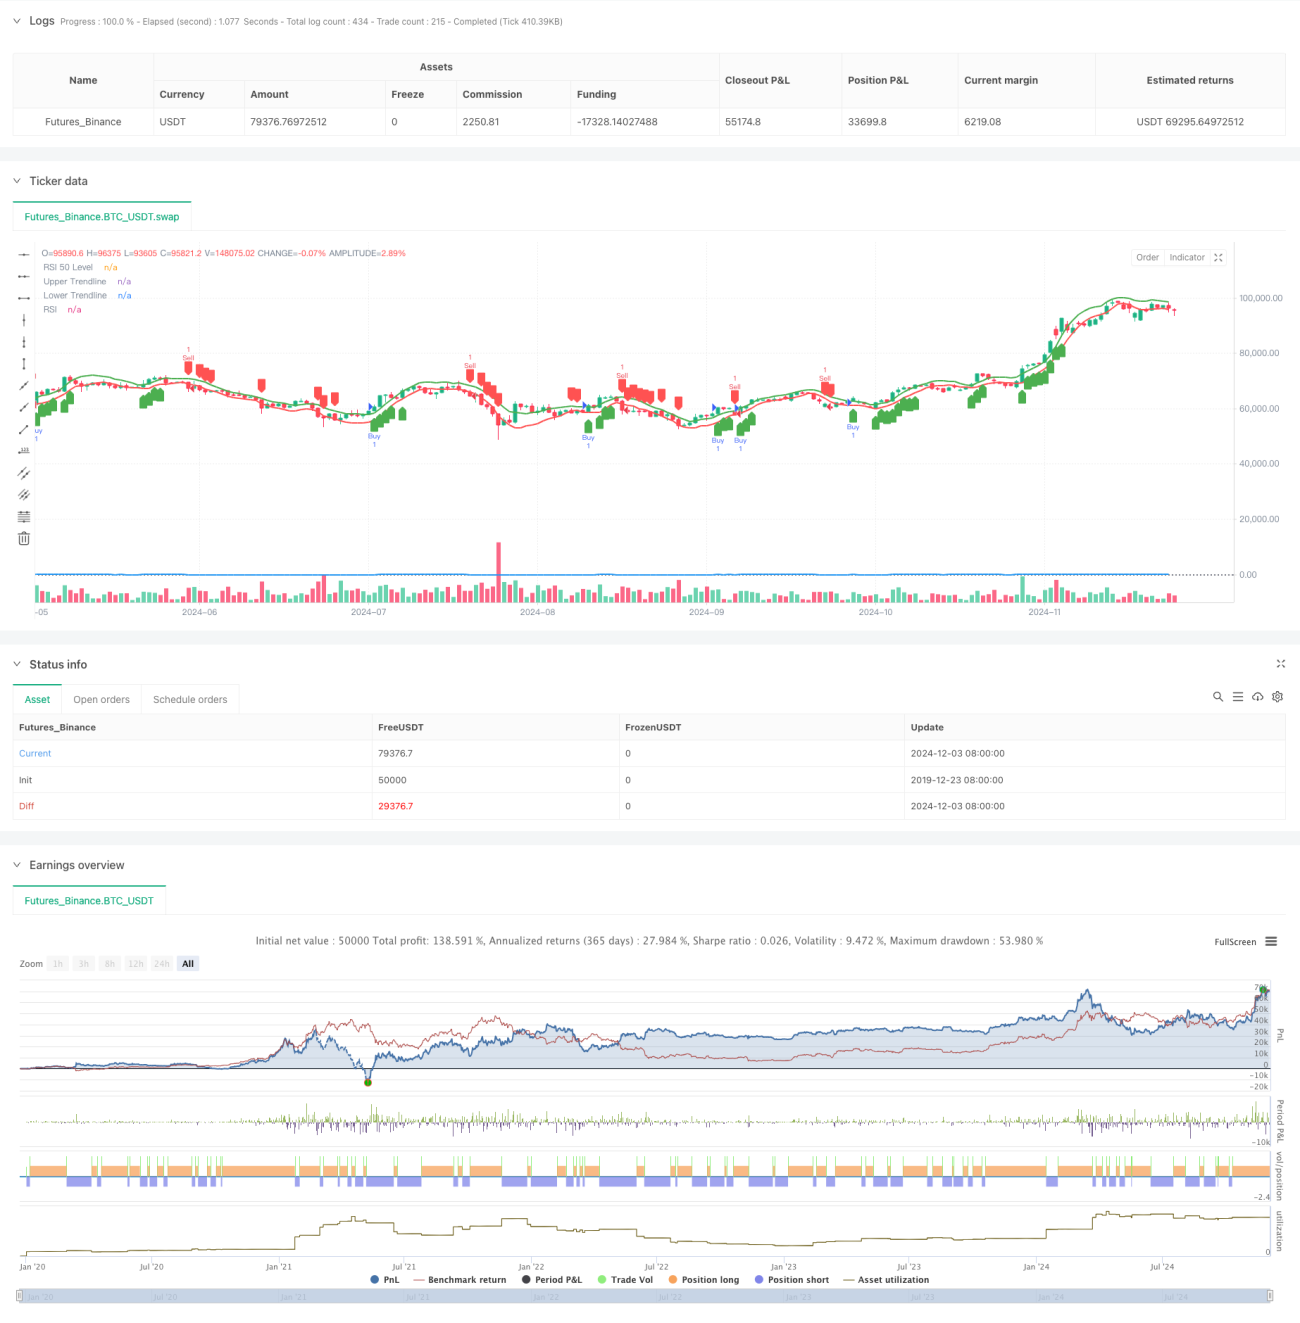
- Sehr gut sichtbar: Trendlinien und Handelssignale werden deutlich auf den Diagrammen dargestellt, um die Strategie zu überwachen und zu analysieren.
- Risiken sind kontrollierbar: Durch den RSI als Filter kann das Risiko von False Breaks wirksam verringert werden.
Strategisches Risiko
- In einem konjunkturellen Zustand kann es zu häufigen Transaktionen kommen, die die Transaktionskosten erhöhen.
- Die Berechnung der Trendlinie basiert auf historischen Daten, die in einem schnell schwankenden Markt möglicherweise nachlässig sind.
- Der RSI kann unter bestimmten Marktbedingungen falsche Signale erzeugen.
- Die Strategie hat keine Stop-Loss-Mechanismen und kann bei starken Marktschwankungen erhebliche Verluste erleiden.
Richtung der Strategieoptimierung
- Einführung eines Stop-Loss-Mechanismus: Es wird empfohlen, einen festen Stop-Loss oder einen beweglichen Stop-Loss hinzuzufügen, um das Risiko zu kontrollieren.
- Optimierung der Einstiegszeit: Erhöhung der Transaktionssicherung und Verbesserung der Zuverlässigkeit der Durchbruchsignale können in Betracht gezogen werden.
- Verbesserte Signalfilterung: Trendfilter können hinzugefügt werden, um häufige Transaktionen in den OTC-Märkten zu vermeiden.
- Optimierung der Dynamikparameter: Es wird empfohlen, die Dreiecklänge und die RSI-Schwelle an die Dynamik der Marktfluktuation anzupassen.
Zusammenfassen
Die Triangle Breakthrough-Strategie in Verbindung mit dem RSI-Dynamik ist ein strukturiertes, logisch klares, quantifiziertes Handelssystem. Durch die Form und die Dynamik des Doppelbestätigungsmechanismus wird die Zuverlässigkeit der Handelssignale wirksam verbessert. Obwohl ein gewisses Risiko besteht, hat die Strategie durch vernünftige Parameteroptimierung und Risikokontrollmaßnahmen einen guten praktischen Wert.
- 1