RSI-ATR Momentum Volatilität Kombinations-Handelsstrategie

Überblick
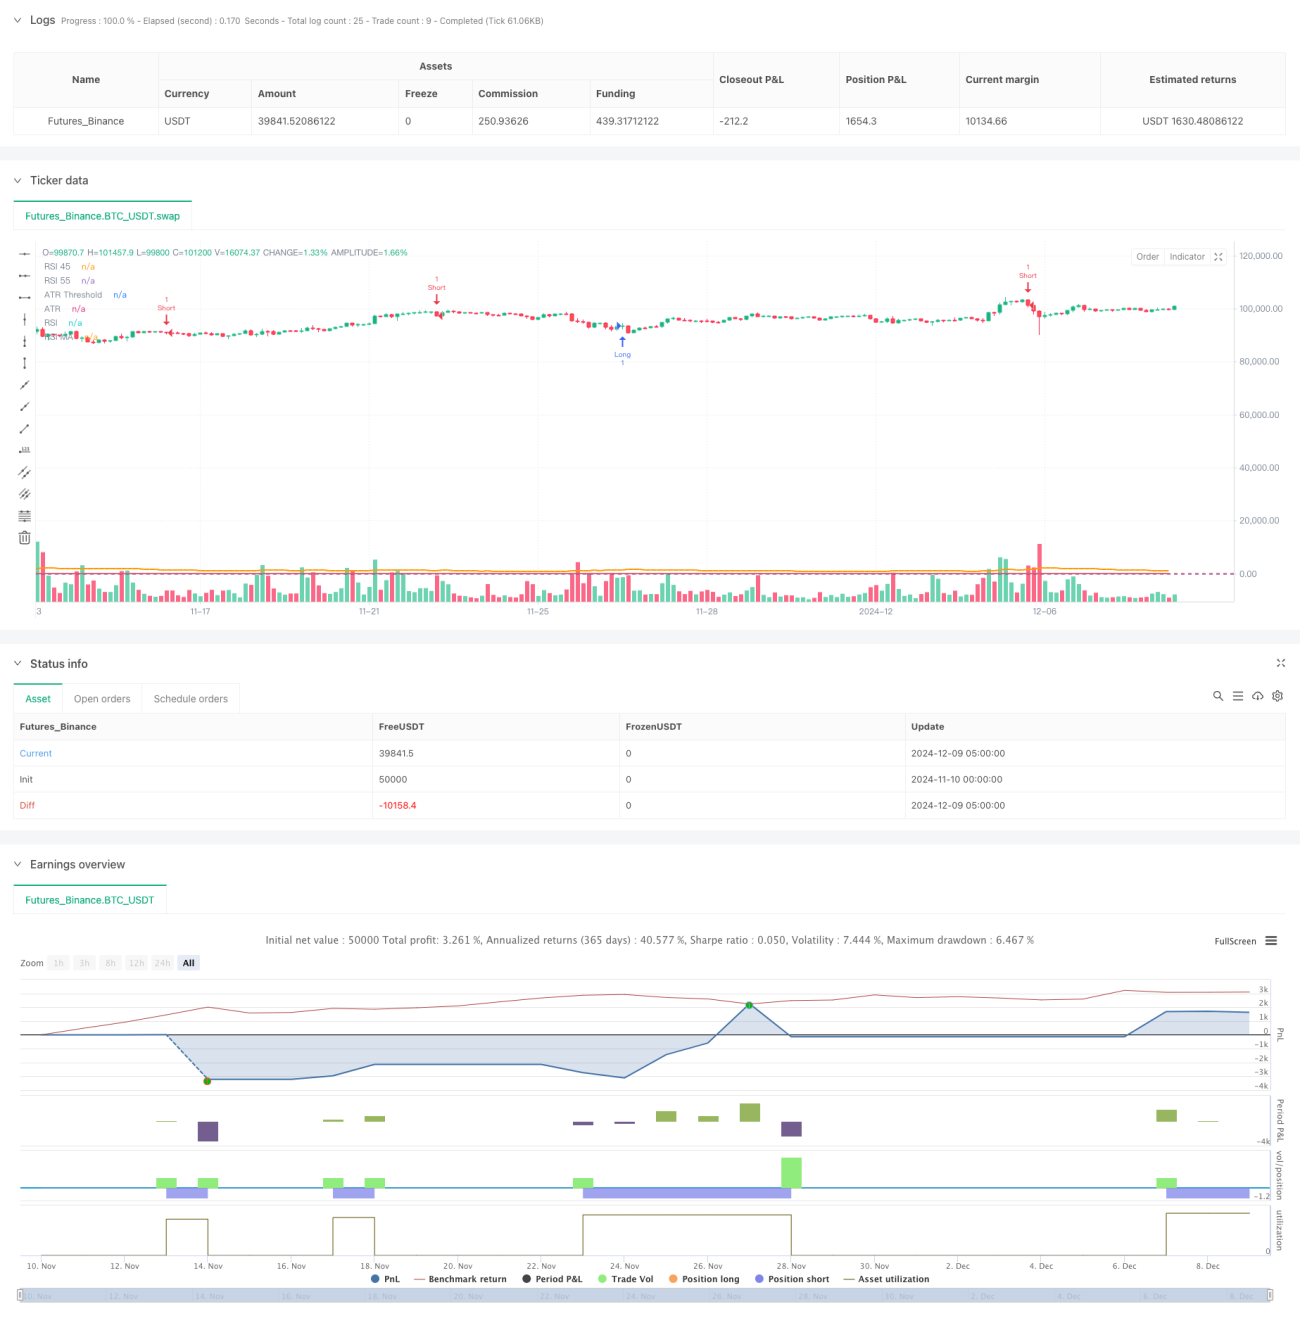
Es handelt sich um ein Trading-Strategie-System, das den RSI-Dynamik- und den ATR-Wirbel-Indikator kombiniert. Die Strategie identifiziert potenzielle Handelschancen, indem sie die Kreuzung des RSI mit seinem Moving Average überwacht, während die ATR-Indikator als Fluktuationsfilter verwendet wird, um sicherzustellen, dass der Markt ausreichend Volatilität aufweist. Die Strategie läuft während der europäischen Handelszeit ((Prager Zeit 8:00-21:00 Uhr) und verwendet einen 5-Minuten-Zeitraum und setzt eine feste Stop-Loss-Ebene ein.
Strategieprinzip
Die Kernlogik der Strategie basiert auf den folgenden Schlüsselkomponenten:
- Der RSI-Indikator wird verwendet, um überkaufte und überverkaufte Bereiche zu identifizieren. Wenn der RSI unter 45 liegt, wird er als überverkaufter Bereich betrachtet, und wenn er über 55 liegt, wird er als überkaufter Bereich betrachtet.
- Die Kreuzung des RSI mit seinem Moving Average als Trigger für ein Einstiegssignal
- Der ATR-Indikator wird verwendet, um eine Umgebung mit geringer Volatilität zu filtern und nur dann zu handeln, wenn der ATR über dem eingestellten Schwellenwert liegt
- Die Handelszeiten sind zwischen 08:00 und 21:00 Uhr (Prager Zeit) begrenzt.
- Die Standard-Stop-Loss-Strategie ist 5000 Punkte.
Die spezifischen Regeln für den Handel lauten:
- Mehrfache Konditionierung: Der RSI unter 45 kreuzt mit seinem Moving Average nach oben und erfüllt die Bedingungen für die Handelszeit und die Volatilität
- Leerlaufbedingungen: Der RSI über 55 kreuzt nach unten mit seinem Moving Average und erfüllt die Bedingungen für die Handelszeit und die Volatilität
- Ausstiegsbedingungen: Berührung der Stop-Position oder der Stop-Loss-Position
Strategische Vorteile
- Multiple Filtermechanismus: kombiniert mit einem Dynamik-Indikator (RSI) und einem Schwankungsrate-Indikator (ATR), um falsche Signale effektiv zu reduzieren
- Zeit-Filterung: Vermeidung von Störungen in Zeiten mit geringer Liquidität durch Begrenzung der Zeitfenster für den Handel
- Gute Risikomanagement: Festgelegte Stop-Loss-Systeme für die Vermögensführung
- Anpassbarkeit der Parameter: Schlüsselparameter wie RSI-Länge, ATR-Tiefstwert usw. können für verschiedene Marktbedingungen optimiert werden
- Die Rückmeldung ergab ein solides Ergebnis: Die Gewinnquote betrug 64,4%, wenn man die Gleitpunkte und die Provisionen berücksichtigt, und die Gewinn-Verlust-Rate lag bei 1,1
Strategisches Risiko
- Fixed Stop Losses sind möglicherweise nicht für alle Marktbedingungen geeignet und können zu einem vorzeitigen Ausstieg in Zeiten starker Volatilität führen
- RSI-Indikatoren können häufige falsche Signale in Trends erzeugen
- ATR-Filter könnten wichtige Marktchancen verpassen
- Zeitfensterbeschränkungen können dazu führen, dass Sie gute Handelsmöglichkeiten in anderen Zeiten verpassen.
- Optimierung von Strategie-abhängigen Parametern, übermäßige Optimierung kann zu einem Risiko einer Überpassung führen
Richtung der Strategieoptimierung
- Dynamische Stop-Losses: Es kann in Betracht gezogen werden, die Stop-Loss-Werte entsprechend der ATR-Dynamik anzupassen, um sie besser an Marktschwankungen anzupassen
- Trendfilter: Hinzufügen von Trendmessern wie beispielsweise Moving Average-Systemen, um falsche Signale in wackligen Märkten zu reduzieren
- Eintrittszeit: Ein zusätzlicher Umsatzindikator kann als zusätzliche Bestätigung in Betracht gezogen werden, um die Eintrittsqualität zu verbessern.
- Optimierung der Zeitfenster: Anpassung der Zeitfenster an die Merkmale der verschiedenen Märkte, um mehr Chancen zu ergreifen
- Erweiterte Module für die Vermögensverwaltung: dynamische Vermögensverwaltung und bessere Risikokontrolle
Zusammenfassen
Die Strategie baut durch die Kombination von RSI und ATR ein relativ vollständiges Handelssystem auf. Die Hauptvorteile der Strategie liegen in der Vielzahl von Filtermechanismen und einem ausgefeilten Risikomanagement, aber es gibt auch einige Einschränkungen. Durch die vorgeschlagene Optimierungsrichtung ist die Strategie berechtigt, eine bessere Leistung zu erzielen.
- 1