Multi-Indikator Trend Momentum Crossover Quantitative Strategie

Überblick
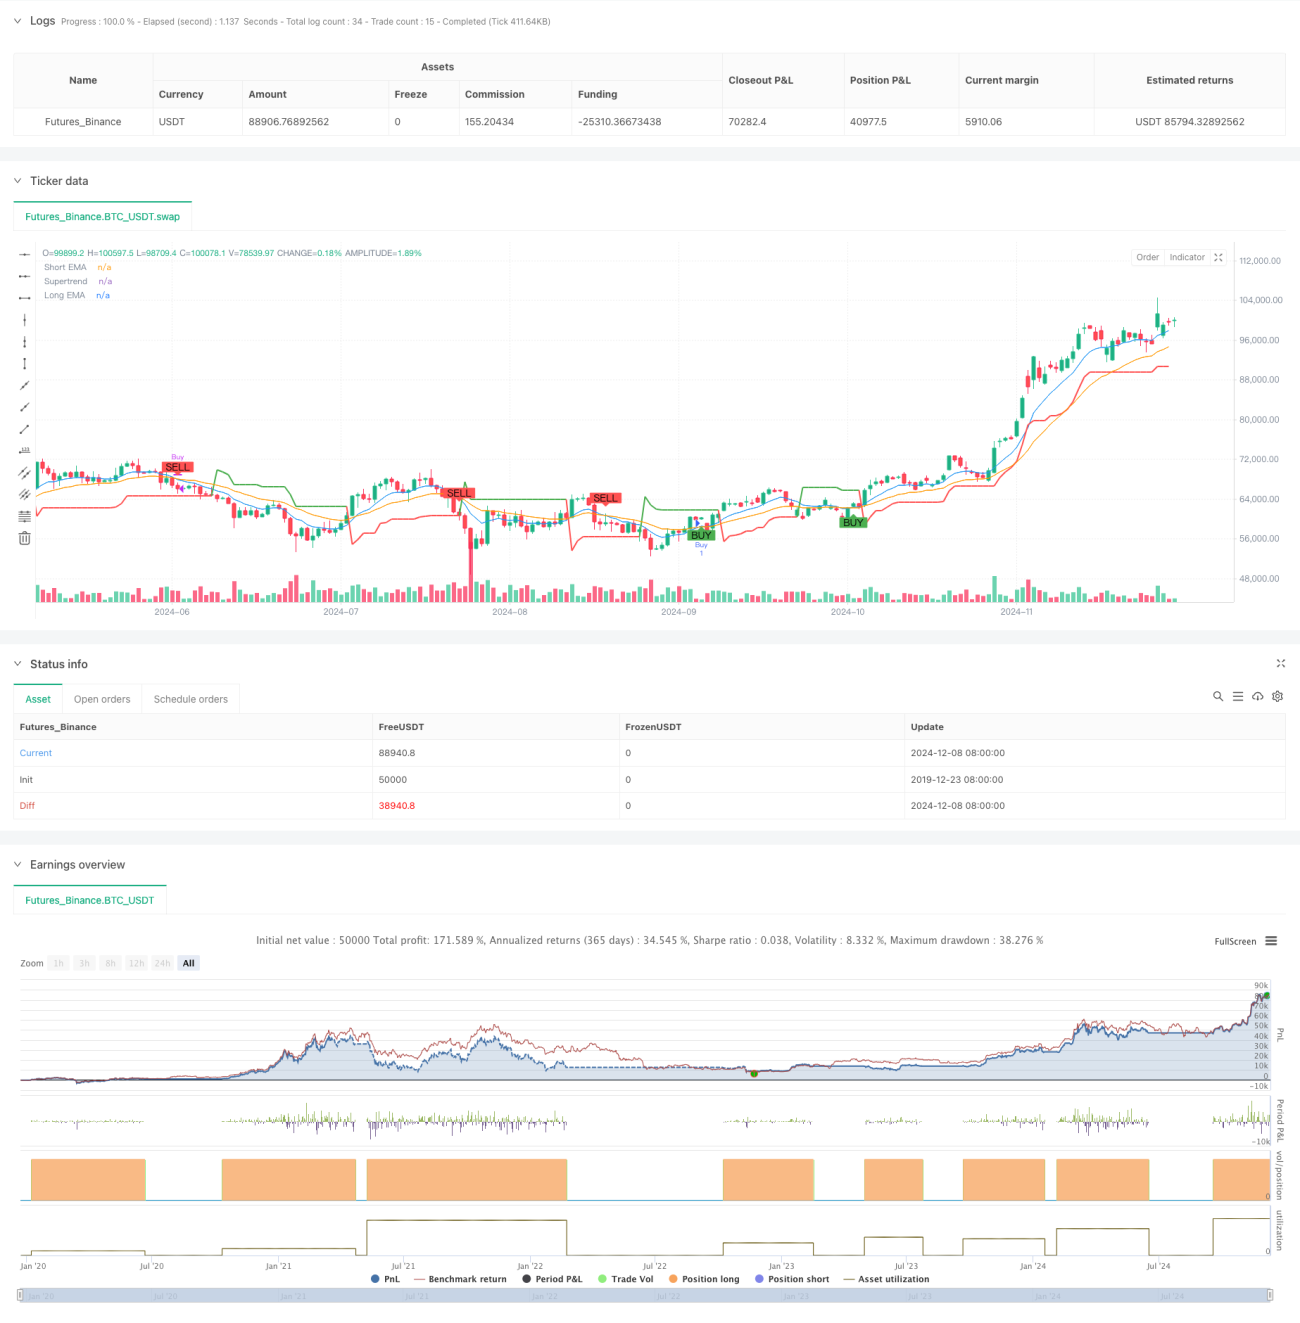
Es handelt sich um eine Multi-Indikator-Trading-Strategie, die den Supertrend, den Index-Moving Average (EMA) und den relativ starken RSI kombiniert. Die Strategie identifiziert Markttrends, -dynamik und potenzielle Wendepunkte durch die Kreuzung von Signalen und Überkauf-Überverkauf-Ebenen dieser drei technischen Indikatoren, um so die idealen Handelsmöglichkeiten in den Märkten zu finden. Die Strategie nutzt die Vorteile mehrerer Indikatoren, um die Genauigkeit und Zuverlässigkeit des Handels durch die Analyse der verschiedenen Dimensionen des Marktes zu verbessern.
Strategieprinzip
Die Kernlogik der Strategie basiert auf einer Kombination von drei wichtigen technischen Indikatoren:
- Der Supertrend-Indikator wird verwendet, um die Richtung des Gesamttrends zu bestimmen und die ATR-Schwankungen zu nutzen, um die Trendlinie dynamisch anzupassen.
- Die Kreuzung von kurzfristigen (Zyklus 9) und langfristigen (Zyklus 21) EMAs wird verwendet, um Veränderungen der Preisdynamik zu erfassen.
- Der RSI-Indikator wird verwendet, um zu erkennen, ob ein Markt überkauft oder überverkauft ist.
Für ein Kaufsignal sind folgende Bedingungen erforderlich:
- Der Supertrend-Indikator zeigt einen mehrseitigen Trend (der Preis liegt oberhalb der Supertrend-Linie)
- Kurzfristige EMA nach oben über langfristige EMA
- Der RSI erreicht nicht den Überkauf (<70)
Das Verkaufssignal muss folgende Bedingungen erfüllen:
- Der Supertrend-Indikator zeigt einen oberflächlichen Trend (der Preis liegt unter der Supertrend-Linie)
- Kurzfristige EMA nach unten durch die langfristige EMA
- Der RSI ist noch nicht überverkauft (< 30).
Strategische Vorteile
- Mehrfache Cross-Verifizierung erhöht Signalsicherheit
- Die Vorteile von Trend-Tracking und Dynamik-Analyse
- Filterung potenzieller Falschsignale durch RSI
- Strategieparameter können flexibel an unterschiedliche Marktbedingungen angepasst werden
- Klare Ein- und Ausstiegsregeln reduzieren die Einflussnahme von subjektiven Urteilen
- Verfügen Sie über einen guten Risikokontrollmechanismus
Strategisches Risiko
- In volatilen Märkten können häufig Fehlsignale auftreten
- Rückstände bei mehreren Kennzahlen können zu geringfügigen Verzögerungen bei der Ein- und Ausstiegszeit führen.
- Eine falsche Parameterauswahl kann die Strategieleistung beeinträchtigen
- Marktausbrüche könnten zu größeren Rückzügen führen
- Die Auswirkungen der Transaktionskosten auf die Strategierendite müssen berücksichtigt werden
Richtung der Strategieoptimierung
- Einführung eines adaptiven Parametermechanismus zur dynamischen Anpassung der Indikatorparameter an die Marktvolatilität
- Hinzufügen von Kennzahlen zur Analyse von Preisen und Verbesserung der Signalsicherheit
- Entwicklung von Modulen zur Identifizierung von Marktumgebungen mit unterschiedlichen Kombinationen von Parametern in verschiedenen Marktumgebungen
- Erhöhung der Stop-Loss- und Stop-Out-Mechanismen und Optimierung der Kapitalverwaltung
- Erwägen Sie die Hinzufügung von Volatilitätsfiltern, um übermäßigen Handel in einer Umgebung mit geringer Volatilität zu vermeiden
Zusammenfassen
Es ist eine strukturierte, logisch klare, mehrindikatorische, quantifizierte Handelsstrategie, die durch die Kombination von Trendverfolgung, Dynamikanalyse und Überkauf-Überverkauf-Indikatoren ein relativ umfassendes Handelssystem aufbaut. Der Vorteil der Strategie liegt in der Mehrindikator-Kreuzüberprüfung, die die Signalsicherheit erhöht, und in der klaren Risikokontrolle. Obwohl einige inhärente Risiken bestehen, wird die Strategie durch kontinuierliche Optimierung und Verbesserung zu einer stabilen Leistung in verschiedenen Marktumgebungen führen.
/*backtest
start: 2019-12-23 08:00:00
end: 2024-12-09 08:00:00
period: 1d
basePeriod: 1d
exchanges: [{"eid":"Futures_Binance","currency":"BTC_USDT"}]
*/

// This Pine Script™ code is subject to the terms of the Mozilla Public License 2.0 at https://mozilla.org/MPL/2.0/
// © satyakipaul3744

//@version=6- 1