Mehrere gleitende Durchschnitte Trendfolgende Handelsstrategie

Überblick
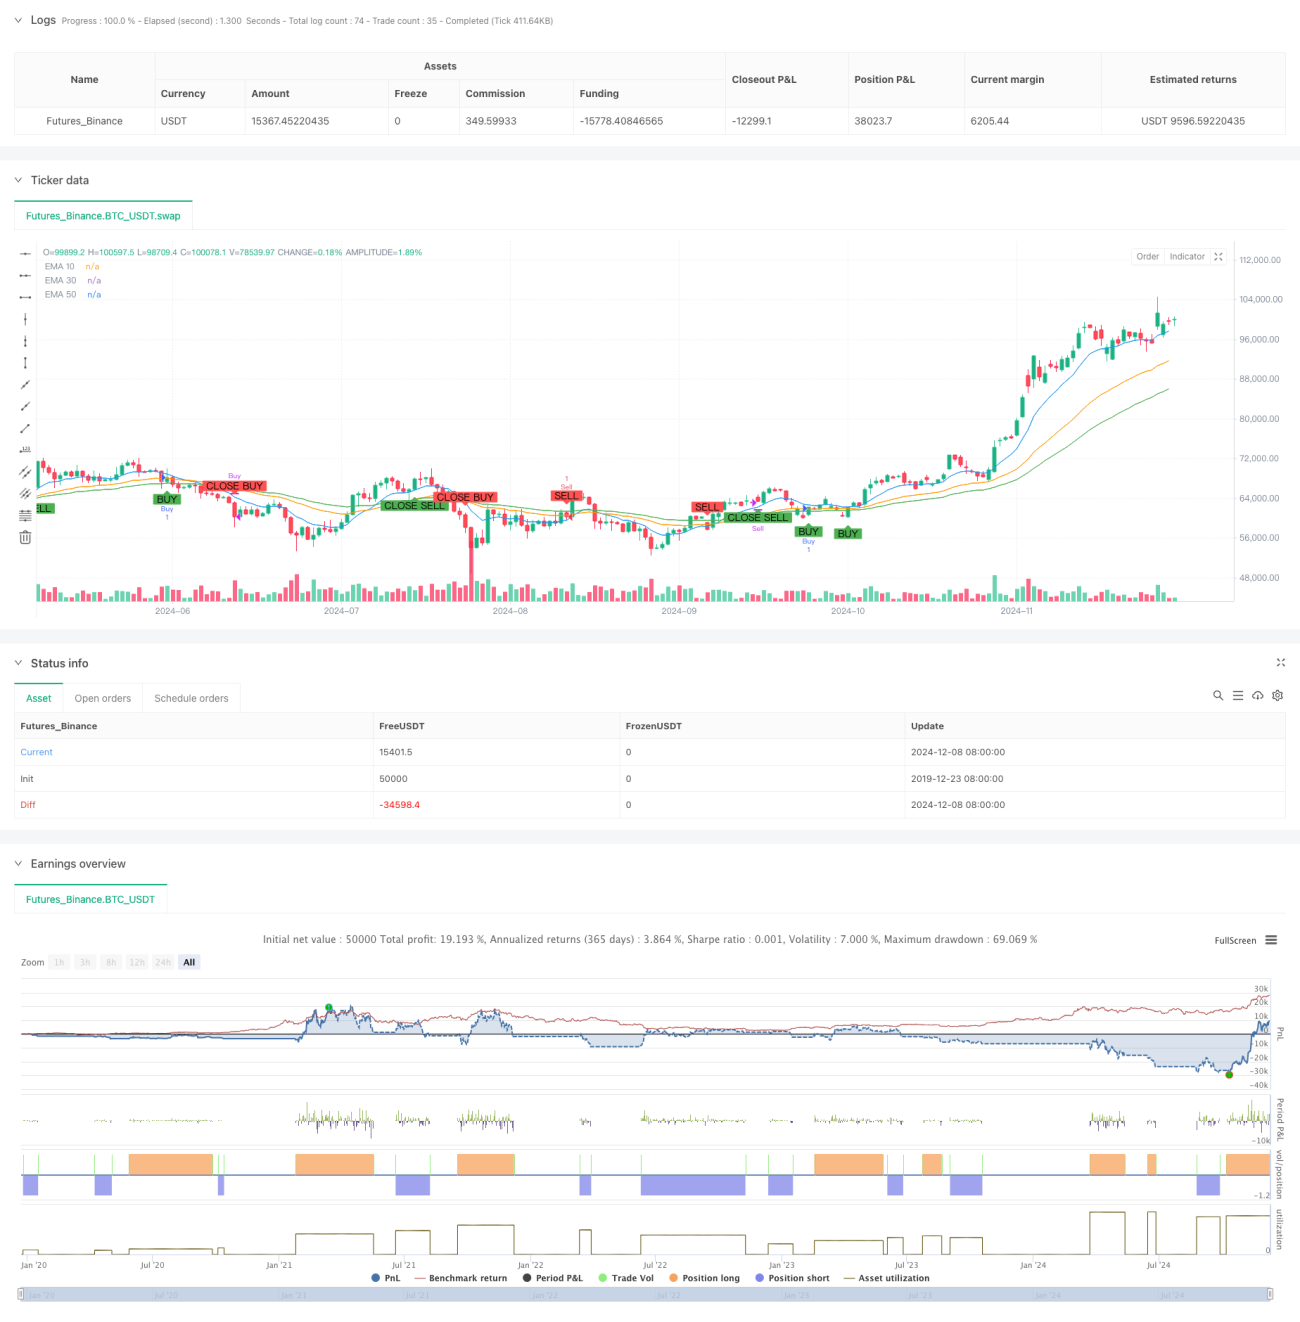
Die Strategie basiert auf einem Trend-Tracking-Trading-System, das auf mehreren Index-Moving Averages (EMA) basiert. Durch die Verwendung von drei EMA-Linien mit unterschiedlichen Perioden (10, 30 und 50), kombiniert mit Preisüberschreitungen und Trendrichtung, wird ein vollständiges System von Kauf- und Verkaufssignalen erstellt. Die Strategie wurde so konzipiert, dass die Entstehung, Bestätigung und Umkehrung von Trends berücksichtigt werden, um die wichtigsten Trendchancen im Markt effektiv zu erfassen.
Strategieprinzip
Die Strategie nutzt hierarchische Beurteilungsmechanismen, um Handelssignale zu ermitteln:
- Trendbeurteilungsebene: Verwendung der positiven Beziehung der drei EMAs ((10/30/50) zur Beurteilung der Trendrichtung. Beurteilt als Aufwärtstrend, wenn EMA10 > EMA30 > EMA50; beurteilt als Abwärtstrend, wenn EMA50 > EMA30 > EMA10 <unk>
- Signal-Trigger-Layer: Auf der Grundlage eines Trends wird ein spezifisches Handelssignal durch eine Kreuzung des Preises mit der EMA30 ausgelöst. Eine Aufwärts-Kreuzung der EMA30 löst einen Kauf aus, eine Abwärts-Kreuzung des EMA30 löst einen Verkauf aus.
- Plateau-Management: Wenn EMA30 und EMA50 sich rückwärts kreuzen, wird ein Plateau-Signal in die jeweilige Richtung ausgelöst. Dies bietet einen systematischen Ausstiegsmechanismus.
Strategische Vorteile
- Mehrere Bestätigungsmechanismen: Mehrfache Bestätigung durch die Anordnung und Kreuzung mehrerer Gleichlinien, um falsche Signalstörungen zu reduzieren.
- Trendspeicher: Sie sind in der Lage, wichtige Trends besser zu erfassen und kurzfristige Schwankungen effektiv zu filtern.
- Systematisch: Eintritts- und Ausstiegsbedingungen sind klar und unabhängig von subjektiven Urteilen.
- Anpassungsfähigkeit: Durch Anpassung der EMA-Parameter an unterschiedliche Marktumgebungen.
- Risikokontrolle ist vernünftig: Risikokontrolle durch zeitnahe Stop-Losses durch Trendwende-Signale.
Strategisches Risiko
- Die Risiken sind häufig falsch, wenn die Märkte schwanken, was zu Verlusten führt.
- Rückstandsrisiko: Ein linearer System hat eine gewisse Rückstandsfähigkeit und kann wichtige Preischancen zu Beginn des Trends verpassen.
- Das Risiko, bei starken Schwankungen eine größere Lücke zu erleiden, beeinflusst die Strategie.
- Parametersensitivität: Unterschiedliche Parameterkombinationen können zu großen Unterschieden in der Strategieleistung führen.
Richtung der Strategieoptimierung
- Einführung von Volatilitätsindikatoren: Es wird empfohlen, Volatilitätsindikatoren wie ATR einzusetzen, um die Positionsgröße dynamisch anzupassen und die Effizienz der Kapitalnutzung zu verbessern.
- Optimierte Signalfilterung: Zusätzliche Kennzahlen wie Verkehrsvolumen und Antriebsmenge können erhöht werden, um falsche Signale zu filtern.
- Verbesserte Schadenshemmungsmechanismen: Es wird empfohlen, die Schadenshemmungsfunktion zu erweitern, um die bereits erzielten Gewinne besser zu schützen.
- Zeit-Filter hinzugefügt: Sie können eine Zeitbeschränkung für den Handel hinzufügen, um eine Zeit zu vermeiden, in der es zu starken Schwankungen kommt.
- Anpassung der Parameter: Erwägen Sie die Einführung eines Anpassungsmechanismus, um die EMA-Parameter an die dynamischen Marktbedingungen anzupassen.
Zusammenfassen
Dies ist eine Strategie, die durch die Kombination von mehreren Durchschnittslinien sowohl die Stabilität der Strategie als auch ein klares Handelssignal gewährleistet. Obwohl ein gewisses Rückstandsrisiko besteht, zeigt die Strategie insgesamt durch vernünftige Optimierungs- und Risikokontrollmaßnahmen einen guten praktischen Wert.
- 1