
Überblick
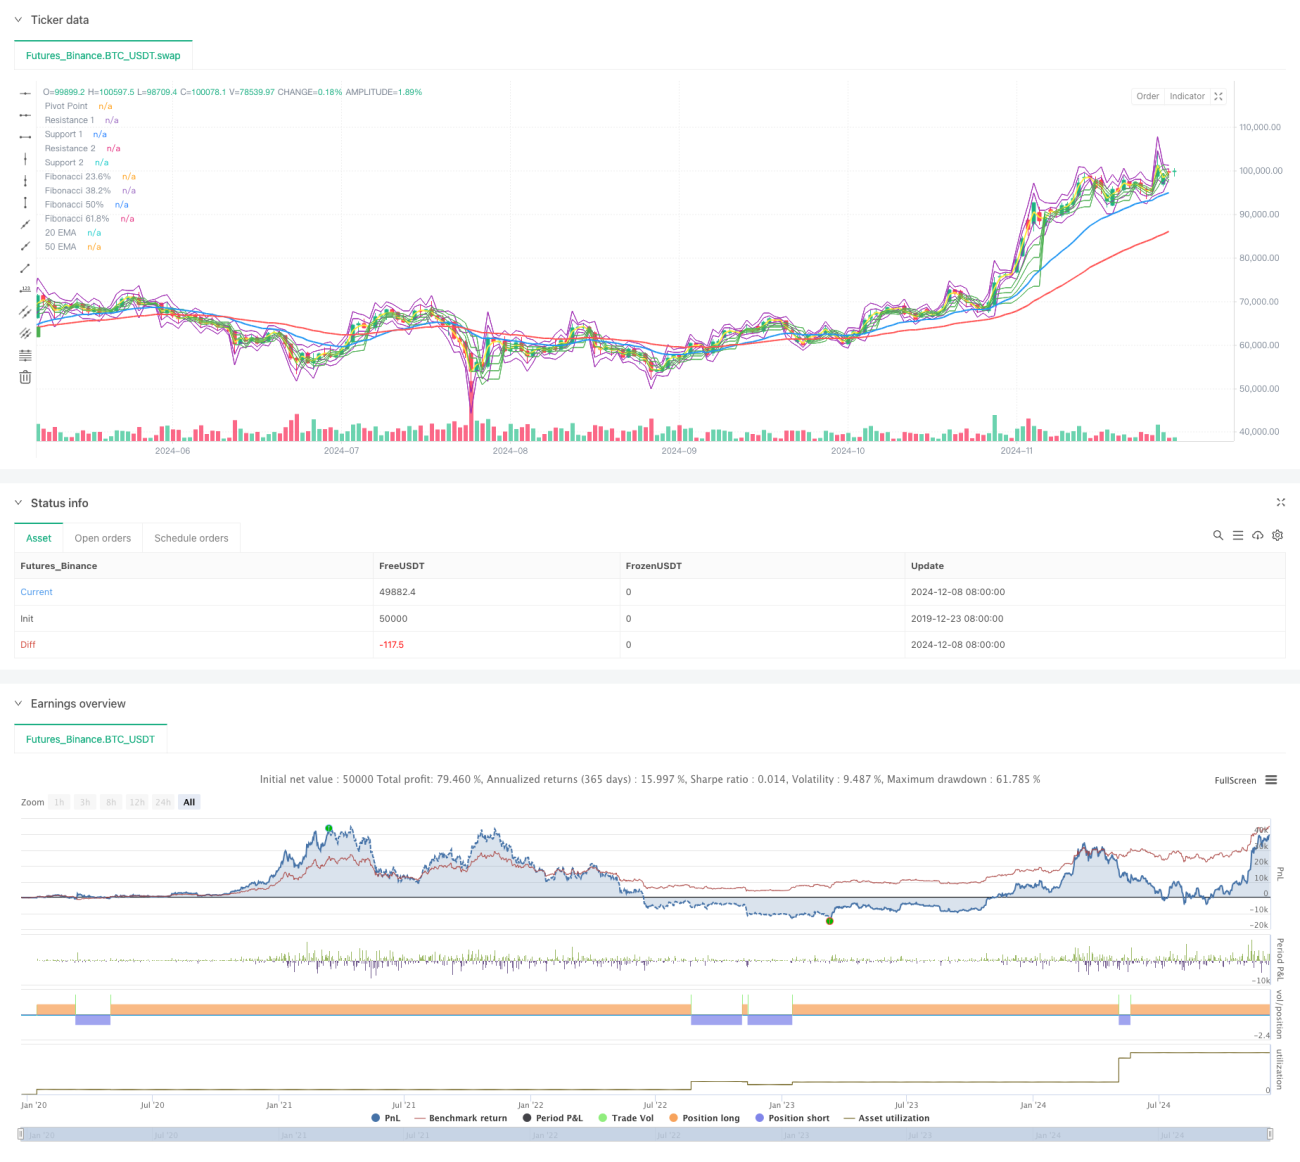
Die Strategie ist ein integriertes Handelssystem, das mehrere technische Analyse-Tools kombiniert und die Handelssignale hauptsächlich anhand der doppelten Mittellinien ((20/50-Zyklus-EMA), Fibonacci-Retracing-Levels und der Widerstandslage an den Pivotpoints bestimmt. Die Strategie verwendet eine Methode, die Trendverfolgung in Kombination mit Preisretracing verwendet, um die Genauigkeit des Handels durch mehrfache Bestätigung zu verbessern.
Strategieprinzip
Die Kernlogik der Strategie basiert auf den folgenden Schlüsselelementen:
- Die Kreuzung der 20- und 50-Perioden-EMA zur Bestimmung der Gesamttrendrichtung
- Potentielle Unterstützungswiderstände werden anhand der Fibonacci-Rückschlussniveaus ((23,6%, 38,2%, 50%, 61,8%) ermittelt
- In Kombination mit dem Pivotpunkt ((PP) und seinen unterstützenden Widerstandspunkten ((S1/S2, R1/R2) wird ein Preis-Kritik-Level bestätigt
- Die Teilnahmevoraussetzungen müssen gleichzeitig erfüllt sein:
- Kurzfristige Durchschnittslinie, die nach oben durch die langfristige Durchschnittslinie geht (mehr) oder nach unten (mehr)
- Der Preis liegt über/unter dem entsprechenden Fibonacci-Wert
- Bestätigung, dass der Preis die Widerstandslage für die Achselstütze erfüllt
- Risikomanagement mit einem festen Stop-Loss (30 Punkte) und einem Gewinnziel (60 Punkte)
Strategische Vorteile
- Mehrfache technische Kennzahlen, um die Signalsicherheit zu verbessern
- Ein Trend mit Unterstützung und Widerstand, um den Einstieg zu balancieren.
- Festgelegte Risikomanagement-Parameter für die quantitative Umsetzung der Strategie
- Visualisierte Handelssignal-Hinweise für die Überwachung in Echtzeit
- Der Kurs ist für den Handel mit mittleren und langen Trends geeignet und reduziert die Auswirkungen von kurzfristigen Schwankungen.
Strategisches Risiko
- Mehrfache Kennzahlen können zu Signalverzögerungen führen, die Eintrittszeiten beeinträchtigen
- Eine feste Stop-Loss-Gewinn-Rate ist möglicherweise nicht für alle Marktbedingungen geeignet.
- In der horizontalen Korrektur könnte es zu viele falsche Signale geben.
- Es ist notwendig, dass die Preise stark schwanken, um optimale Erträge zu erzielen.
- Stopps können bei starken Marktschwankungen ausfallen.
Richtung der Strategieoptimierung
- Einführung von Stop-Loss-Stopp-Mechanismen, die sich an die Schwankungen anpassen
- Lautstärkeanzeige als Zusatzbestätigung hinzufügen
- Durchschnittliche Parameter, die dynamisch an unterschiedliche Marktbedingungen angepasst werden
- Fügen Sie einen Trendstärkefilter hinzu, um falsche Signale zu reduzieren
- Entwicklung von intelligenten Teilpositionsverwaltungsmechanismen
Zusammenfassen
Durch die Integration mehrerer klassischer technischer Analyse-Tools wurde ein relativ vollständiges Handelssystem aufgebaut. Obwohl es eine gewisse Rückständigkeit gibt, wurde die Zuverlässigkeit des Handels durch mehrere Bestätigungsmechanismen erhöht. Durch die Umsetzung von Optimierungsempfehlungen wird die Strategie eine bessere Leistung im realen Handel erwarten. Es wird empfohlen, vor dem Einsatz im realen Markt ausreichend Rückmeldungen zu machen und die Parameter an die spezifischen Markteigenschaften anzupassen.
- 1