Überblick
Die Strategie ist eine Trend-Tracking-Strategie, die auf Index-Moving Averages (EMA) und Dynamic Indicators basiert. Sie handelt durch die Kombination von Dynamic Breakout Signalen und EMA-Trendfiltern, wenn die Markttrends eindeutig sind. Die Strategie enthält ein vollständiges Risikomanagement-Modul, ein flexibles Handelszeitfilter und detaillierte statistische Analysefunktionen, um die Stabilität und Zuverlässigkeit der Strategie zu verbessern.
Strategieprinzip
Die Kernlogik der Strategie basiert auf den folgenden Schlüsselelementen:
- Antriebssignalerkennung: Durch die Berechnung von Antriebswerten in einem benutzerdefinierten Zeitrahmen erzeugt das Antrieb mehrere Signale, wenn der Antrieb die Obergrenze überschreitet, und ein Abbruchsignal, wenn die Untergrenze überschritten wird.
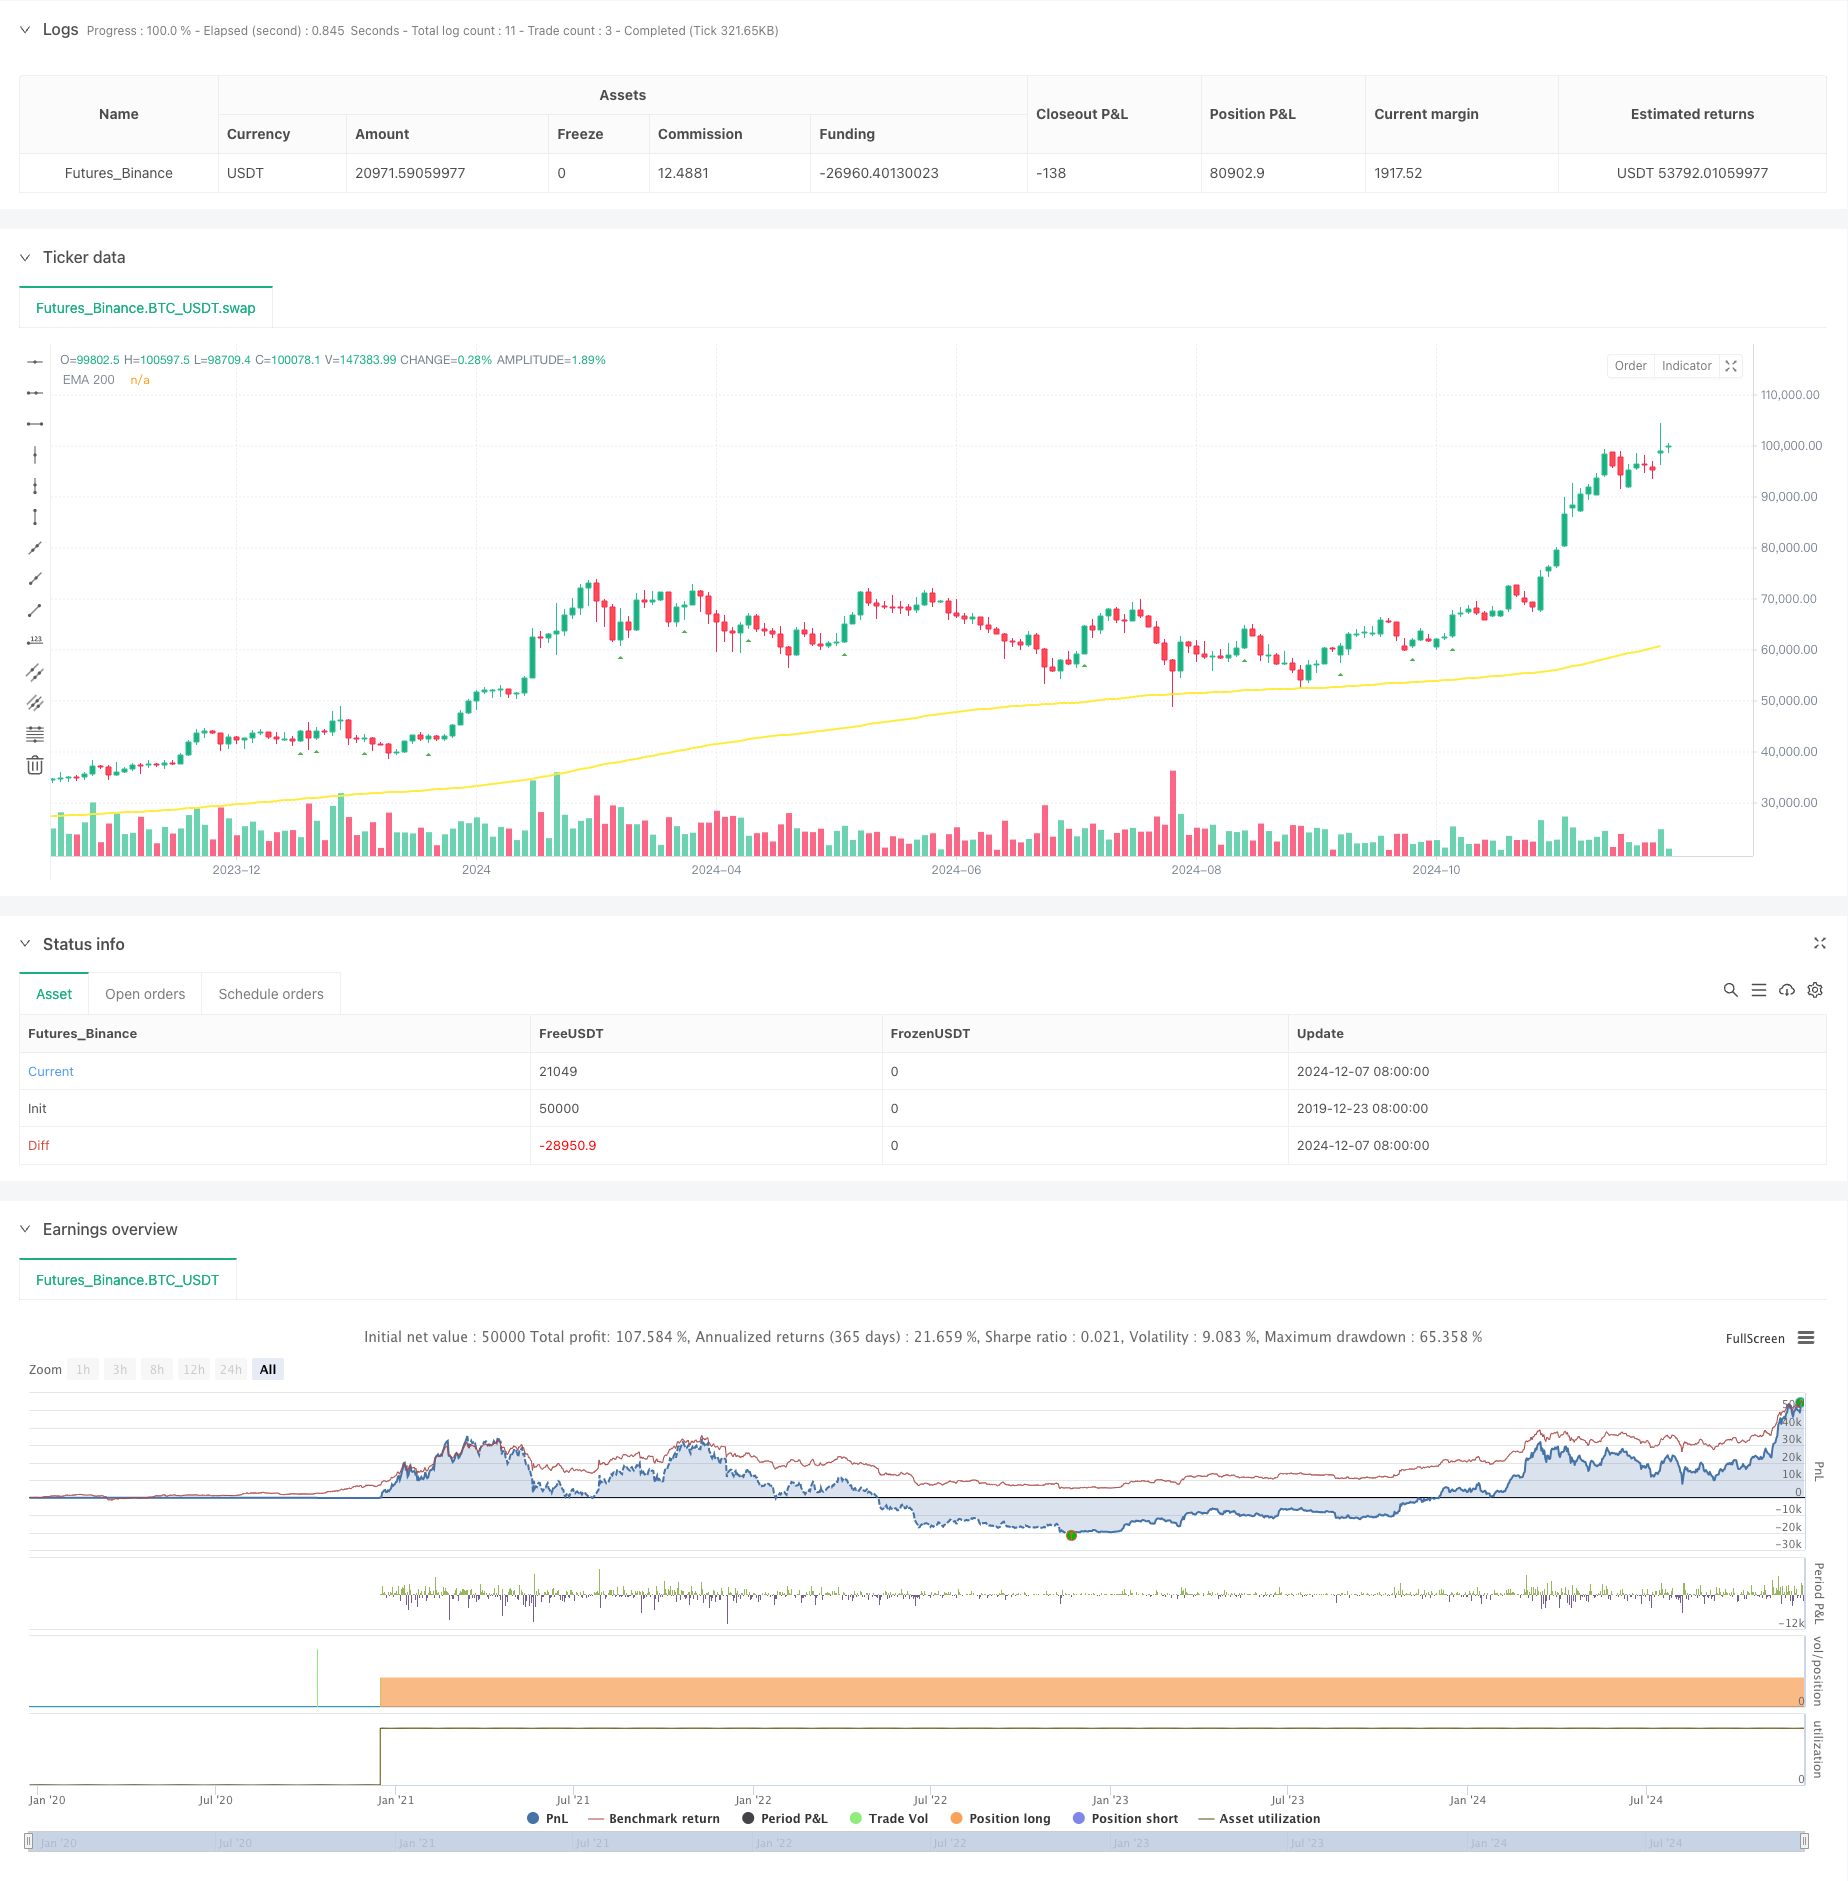
- EMA-Trendfilter: Die 200-Zyklus-EMA wird als Trend-Basis verwendet, wobei der Preis oberhalb der EMA eine Übernahme erlaubt und der Preis unterhalb der EMA eine Unterbrechung erlaubt.
- Zeitfilter: Sie können spezifische Handelszeiten festlegen und unterstützen die Anpassung der GMT-Zeitzone, um die Strategie besser an die Handelszeiten verschiedener Märkte anzupassen.
- Risikokontrolle: Unterstützung von Stop-Loss- und Stop-Out-Einstellungen basierend auf ATR oder festen Prozentsätzen und Begrenzung der maximalen Anzahl von Transaktionen pro Tag.
Strategische Vorteile
- Trend-Tracking-Fähigkeit: Durch die doppelte Bestätigung von EMA und Dynamik können die wichtigsten Trends effektiv erfasst werden.
- Gute Risikomanagement: Eine Vielzahl von Stop-Strategien zur Verfügung, sowohl mit ATR-Dynamischen Stop-Strategien als auch mit Fix-Prozentsatz Stop-Strategien.
- Umfassende statistische Analyse: Echtzeit-Tracking mehrerer Leistungsindikatoren, einschließlich der Mehrflug-Gewinnrate, des Risikos-Gewinn-Verhältnisses usw.
- Die Parameter können flexibel angepasst werden: Die Hauptparameter können entsprechend den Merkmalen des Marktes optimiert und angepasst werden.
Strategisches Risiko
Schwankungsrisiko: In schwankenden Märkten kann es zu häufigen Falschbrüchen kommen. Empfehlung: Erhöhung der Schwingungsfilter oder der Breakout-Schwelle.
Schlupfrisiko: In Zeiten starker Schwankungen kann es zu einem größeren Schlupf kommen. Die empfohlene Lösung: Setzen Sie eine angemessene Stop-Loss-Range und vermeiden Sie den Handel in Zeiten hoher Volatilität.
Überhändlerrisiko: Überhäufige Signale können zu Überhändlungen führen. Empfehlung: Setzen Sie eine angemessene Grenze für die maximale Anzahl von Transaktionen pro Tag.
Richtung der Strategieoptimierung
- Dynamische Parameter-Optimierung: Dynamische Abwertungen und EMA-Perioden können automatisch an Marktschwankungen angepasst werden.
- Mehrzeit-Analyse: Trendbestätigung mit mehreren Zeiträumen, Signalzuverlässigkeit erhöht.
- Marktumfelderkennung: Hinzu kommt ein Modul zur Analyse der Volatilität, mit dem unterschiedliche Parameter-Einstellungen in verschiedenen Marktumgebungen verwendet werden können.
- Signalstärke: Die Signalstärke des Durchbruchs wird nach der Dynamik der Signalstärke angepasst.
Zusammenfassen
Es ist eine gut entwickelte Trend-Tracking-Strategie, um Marktchancen zu erfassen, indem Sie Dynamik-Breakthroughs und EMA-Trends kombinieren. Die Strategie verfügt über ein vollständiges Risikomanagementsystem, eine starke statistische Analysefunktion, eine gute Praxistauglichkeit und Skalierbarkeit. Durch kontinuierliche Optimierung und Verbesserung wird die Strategie in der Lage sein, eine stabile Leistung in verschiedenen Marktumgebungen zu halten.
/*backtest
start: 2019-12-23 08:00:00
end: 2024-12-09 08:00:00
period: 2d
basePeriod: 2d
exchanges: [{"eid":"Futures_Binance","currency":"BTC_USDT"}]
*/

//@version=6
strategy("[Mustang Algo] EMA Momentum Strategy",
         shorttitle="[Mustang Algo] Mom Strategy",
         overlay=true,
         initial_capital=10000,
         default_qty_type=strategy.fixed,
         default_qty_value=1,
         pyramiding=0,
         calc_on_every_tick=false,
         max_bars_back=5000)

// Momentum Parameters
len = input.int(10, minval=1, title="Length")
src = input(close, title="Source")
momTimeframe = input.timeframe("", title="Momentum Timeframe")
timeframe_gaps = input.bool(true, title="Autoriser les gaps de timeframe")
momFilterLong = input.float(5, title="Filtre Momentum Long", minval=0)
momFilterShort = input.float(-5, title="Filtre Momentum Short", maxval=0)

// EMA Filter
useEmaFilter = input.bool(true, title="Utiliser Filtre EMA")
emaLength = input.int(200, title="EMA Length", minval=1)

// Position Size
contractSize = input.float(1.0, title="Taille de position", minval=0.01, step=0.01)

// Time filter settings
use_time_filter = input.bool(false, title="Utiliser le Filtre de Temps")
start_hour = input.int(9, title="Heure de Début", minval=0, maxval=23)
start_minute = input.int(30, title="Minute de Début", minval=0, maxval=59)
end_hour = input.int(16, title="Heure de Fin", minval=0, maxval=23)
end_minute = input.int(30, title="Minute de Fin", minval=0, maxval=59)
gmt_offset = input.int(0, title="Décalage GMT", minval=-12, maxval=14)

// Risk Management
useAtrSl = input.bool(false, title="Utiliser ATR pour SL/TP")
atrPeriod = input.int(14, title="Période ATR", minval=1)
atrMultiplier = input.float(1.5, title="Multiplicateur ATR pour SL", minval=0.1, step=0.1)
stopLossPerc = input.float(1.0, title="Stop Loss (%)", minval=0.01, step=0.01)
tpRatio = input.float(2.0, title="Take Profit Ratio", minval=0.1, step=0.1)

// Daily trade limit
maxDailyTrades = input.int(2, title="Limite de trades par jour", minval=1)

// Variables for tracking daily trades
var int dailyTradeCount = 0

// Reset daily trade count
if dayofweek != dayofweek[1]
    dailyTradeCount := 0

// Time filter function
is_within_session() =>
    current_time = time(timeframe.period, "0000-0000:1234567", gmt_offset)
    start_time = timestamp(year, month, dayofmonth, start_hour, start_minute, 0)
    end_time = timestamp(year, month, dayofmonth, end_hour, end_minute, 0)
    in_session = current_time >= start_time and current_time <= end_time
    not use_time_filter or in_session

// EMA Calculation
ema200 = ta.ema(close, emaLength)

// Momentum Calculation
gapFillMode = timeframe_gaps ? barmerge.gaps_on : barmerge.gaps_off
mom = request.security(syminfo.tickerid, momTimeframe, src - src[len], gapFillMode)

// ATR Calculation
atr = ta.atr(atrPeriod)

// Signal Detection with Filters
crossoverUp = ta.crossover(mom, momFilterLong)
crossoverDown = ta.crossunder(mom, momFilterShort)

emaUpTrend = close > ema200
emaDownTrend = close < ema200

// Trading Conditions
longCondition = crossoverUp and (not useEmaFilter or emaUpTrend) and is_within_session() and dailyTradeCount < maxDailyTrades and barstate.isconfirmed
shortCondition = crossoverDown and (not useEmaFilter or emaDownTrend) and is_within_session() and dailyTradeCount < maxDailyTrades and barstate.isconfirmed

// Calcul des niveaux de Stop Loss et Take Profit
float stopLoss = useAtrSl ? (atr * atrMultiplier) : (close * stopLossPerc / 100)
float takeProfit = stopLoss * tpRatio

// Modification des variables pour éviter les erreurs de repainting
var float entryPrice = na
var float currentStopLoss = na
var float currentTakeProfit = na

// Exécution des ordres avec gestion des positions
if strategy.position_size == 0
    if longCondition
        entryPrice := close
        currentStopLoss := entryPrice - stopLoss
        currentTakeProfit := entryPrice + takeProfit
        strategy.entry("Long", strategy.long, qty=contractSize)
        strategy.exit("Exit Long", "Long", stop=currentStopLoss, limit=currentTakeProfit)
        dailyTradeCount += 1

    if shortCondition
        entryPrice := close
        currentStopLoss := entryPrice + stopLoss
        currentTakeProfit := entryPrice - takeProfit
        strategy.entry("Short", strategy.short, qty=contractSize)
        strategy.exit("Exit Short", "Short", stop=currentStopLoss, limit=currentTakeProfit)
        dailyTradeCount += 1

// Plot EMA
plot(ema200, color=color.yellow, linewidth=2, title="EMA 200")

// Plot Signals
plotshape(longCondition, title="Long Signal", location=location.belowbar, color=color.green, style=shape.triangleup, size=size.small)
plotshape(shortCondition, title="Short Signal", location=location.abovebar, color=color.red, style=shape.triangledown, size=size.small)

// // Performance Statistics
// var int longWins = 0
// var int longLosses = 0
// var int shortWins = 0
// var int shortLosses = 0

// if strategy.closedtrades > 0
//     trade = strategy.closedtrades - 1
//     isLong = strategy.closedtrades.entry_price(trade) < strategy.closedtrades.exit_price(trade)
//     isWin = strategy.closedtrades.profit(trade) > 0

//     if isLong and isWin
//         longWins += 1
//     else if isLong and not isWin
//         longLosses += 1
//     else if not isLong and isWin
//         shortWins += 1
//     else if not isLong and not isWin
//         shortLosses += 1

// longTrades = longWins + longLosses
// shortTrades = shortWins + shortLosses

// longWinRate = longTrades > 0 ? (longWins / longTrades) * 100 : 0
// shortWinRate = shortTrades > 0 ? (shortWins / shortTrades) * 100 : 0
// overallWinRate = strategy.closedtrades > 0 ? (strategy.wintrades / strategy.closedtrades) * 100 : 0

// avgRR = strategy.grossloss != 0 ? math.abs(strategy.grossprofit / strategy.grossloss) : 0

// // Display Statistics
// var table statsTable = table.new(position.top_right, 4, 7, border_width=1)
// if barstate.islastconfirmedhistory
//     table.cell(statsTable, 0, 0, "Type", bgcolor=color.new(color.blue, 90))
//     table.cell(statsTable, 1, 0, "Win", bgcolor=color.new(color.blue, 90))
//     table.cell(statsTable, 2, 0, "Lose", bgcolor=color.new(color.blue, 90))
//     table.cell(statsTable, 3, 0, "Daily Trades", bgcolor=color.new(color.blue, 90))
//     table.cell(statsTable, 0, 1, "Long", bgcolor=color.new(color.blue, 90))
//     table.cell(statsTable, 1, 1, str.tostring(longWins), bgcolor=color.new(color.blue, 90))
//     table.cell(statsTable, 2, 1, str.tostring(longLosses), bgcolor=color.new(color.blue, 90))
//     table.cell(statsTable, 3, 1, str.tostring(dailyTradeCount) + "/" + str.tostring(maxDailyTrades), bgcolor=color.new(color.blue, 90))
//     table.cell(statsTable, 0, 2, "Short", bgcolor=color.new(color.blue, 90))
//     table.cell(statsTable, 1, 2, str.tostring(shortWins), bgcolor=color.new(color.blue, 90))
//     table.cell(statsTable, 2, 2, str.tostring(shortLosses), bgcolor=color.new(color.blue, 90))
//     table.cell(statsTable, 0, 3, "Win Rate", bgcolor=color.new(color.blue, 90))
//     table.cell(statsTable, 1, 3, "Long: " + str.tostring(longWinRate, "#.##") + "%", bgcolor=color.new(color.blue, 90))
//     table.cell(statsTable, 2, 3, "Short: " + str.tostring(shortWinRate, "#.##") + "%", bgcolor=color.new(color.blue, 90))
//     table.cell(statsTable, 0, 4, "Overall", bgcolor=color.new(color.blue, 90))
//     table.cell(statsTable, 1, 4, "Win Rate: " + str.tostring(overallWinRate, "#.##") + "%", bgcolor=color.new(color.blue, 90))
//     table.cell(statsTable, 2, 4, "Total: " + str.tostring(strategy.closedtrades) + " | RR: " + str.tostring(avgRR, "#.##"), bgcolor=color.new(color.blue, 90))
//     table.cell(statsTable, 0, 5, "Trading Hours", bgcolor=color.new(color.blue, 90))
//     table.cell(statsTable, 1, 5, "Start: " + str.format("{0,time,HH:mm}", start_hour * 60 * 60 * 1000 + start_minute * 60 * 1000), bgcolor=color.new(color.blue, 90))
//     table.cell(statsTable, 2, 5, "End: " + str.format("{0,time,HH:mm}", end_hour * 60 * 60 * 1000 + end_minute * 60 * 1000), bgcolor=color.new(color.blue, 90))
//     table.cell(statsTable, 3, 5, "GMT: " + (gmt_offset >= 0 ? "+" : "") + str.tostring(gmt_offset), bgcolor=color.new(color.blue, 90))
//     table.cell(statsTable, 0, 6, "SL/TP Method", bgcolor=color.new(color.blue, 90))
//     table.cell(statsTable, 1, 6, useAtrSl ? "ATR-based" : "Percentage-based", bgcolor=color.new(color.blue, 90))
//     table.cell(statsTable, 2, 6, useAtrSl ? "ATR: " + str.tostring(atrPeriod) : "SL%: " + str.tostring(stopLossPerc), bgcolor=color.new(color.blue, 90))
//     table.cell(statsTable, 3, 6, "TP Ratio: " + str.tostring(tpRatio), bgcolor=color.new(color.blue, 90))