
Überblick
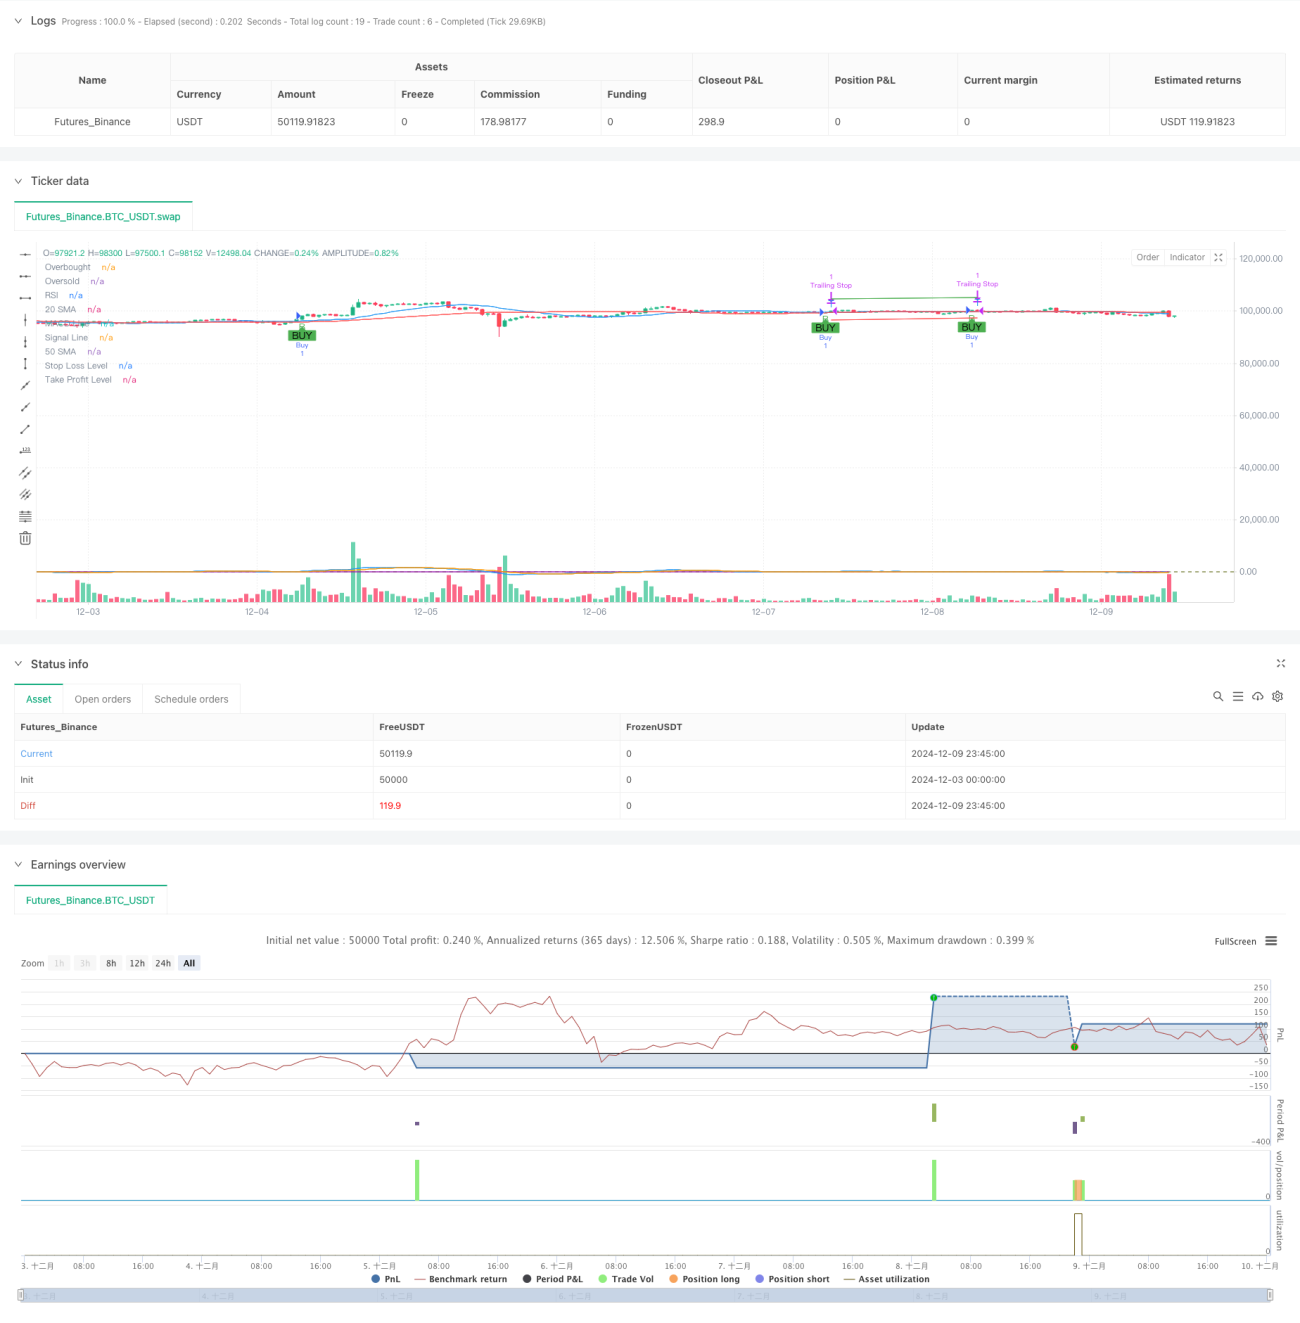
Die Strategie ist ein Trend-Tracking-Trading-System, das mehrere technische Indikatoren wie den RSI (Relativ-Strength-Indikator), MACD (Moving Average Trend Scatter) und SMA (Simple Moving Average) kombiniert, um zu handeln, wenn die Markttrends eindeutig sind. Die Strategie enthält auch Risikomanagementmechanismen wie Stop Loss, Stop Loss und Tracking Stop Loss, um eine bessere Geldverwaltung zu ermöglichen.
Strategieprinzip
Die Strategie basiert auf den folgenden Kernbedingungen:
- MACD-Indikator mit Goldfalke (Signalstränge über die MACD-Linie)
- RSI unter 70 und Vermeidung von Überkaufzonen
- Der Preis liegt über dem kurzfristigen Durchschnitt (der 20-Tage-Durchschnitt)
- Die kurzfristige Durchschnittslinie liegt über der langfristigen Durchschnittslinie (die 50-Tage-Durchschnittslinie)
Wenn die oben genannten Bedingungen gleichzeitig erfüllt werden, wird ein mehrfaches Signal ausgegeben. Die Strategie setzt außerdem ein Stop-Loss-Ziel von 5%, eine Stop-Loss-Grenze von 3% und ein Tracking-Stop-Loss von 2% fest, um bereits erzielte Gewinne zu schützen. Diese mehrschichtige Gestaltung der Handelsbedingungen trägt zur Erhöhung der Genauigkeit und Sicherheit des Handels bei.
Strategische Vorteile
- Die integrierte Verwendung von mehreren technischen Indikatoren erhöht die Zuverlässigkeit von Handelssignalen
- Überkaufbereiche durch RSI-Filter, um einen Einstieg bei hohen Kursen zu vermeiden
- Der Einsatz von Mittellinien hilft bei der Bestätigung von mittleren und langen Trends
- Gute Risikomanagement-Mechanismen, einschließlich fester Stop-Losses und Verfolgung von Stop-Losses
- Strategieparameter können flexibel an unterschiedliche Marktbedingungen angepasst werden
- Die Handelszeiträume sind individuell anpassbar, um die Rückverfolgung und die Anwendung auf dem Markt zu erleichtern.
Strategisches Risiko
- Mehrfache Kennzahlen können zu Signalverzögerungen führen, die Eintrittszeiten beeinträchtigen
- In volatilen Märkten können falsche Signale auftreten
- Ein fester Stop-Loss-Ratio ist möglicherweise nicht für alle Marktbedingungen geeignet.
- Stopp-Tracking kann zu früh aus dem Gewinn treten, wenn der Markt stark schwankt
Minderungsmaßnahmen umfassen: Anpassung der Kennzahlen, Anpassung des Stop-Loss-Verhältnisses an die Markteigenschaften, Erhöhung der Filter für die Marktumgebung usw.
Richtung der Strategieoptimierung
- Einführung von Volatilitätsindikatoren (wie ATR), um die Stop-Loss-Anpassung zu erleichtern
- Erhöhung der Signalwirksamkeit von Transaktionsindikatoren
- Hinzufügen von Marktumfeld-Beschlussmechanismen mit unterschiedlichen Parametern für unterschiedliche Marktbedingungen
- Optimierung der MACD-Parameter zur Verbesserung der Signalzeit
- Erwägen Sie die Aufnahme von Rückwärtssignalen, um eine Lüftungsfunktion zu realisieren
Diese Optimierungsmaßnahmen können die Anpassungsfähigkeit und Stabilität der Strategie verbessern.
Zusammenfassen
Die Strategie baut durch die kombinierte Verwendung von mehreren technischen Indikatoren ein relativ gutes Handelssystem auf. Sie enthält nicht nur die Kernlogik des Trendverfolgens, sondern auch Risikomanagement-Bedenken. Obwohl es einige Optimierungsmöglichkeiten gibt, ist das Gesamt-Framework gut skalierbar und anpassungsfähig.
- 1