Trendfolgestrategie mit mehreren Indikatoren kombiniert mit einem dynamischen Kanal- und gleitenden Durchschnittshandelssystem

Überblick
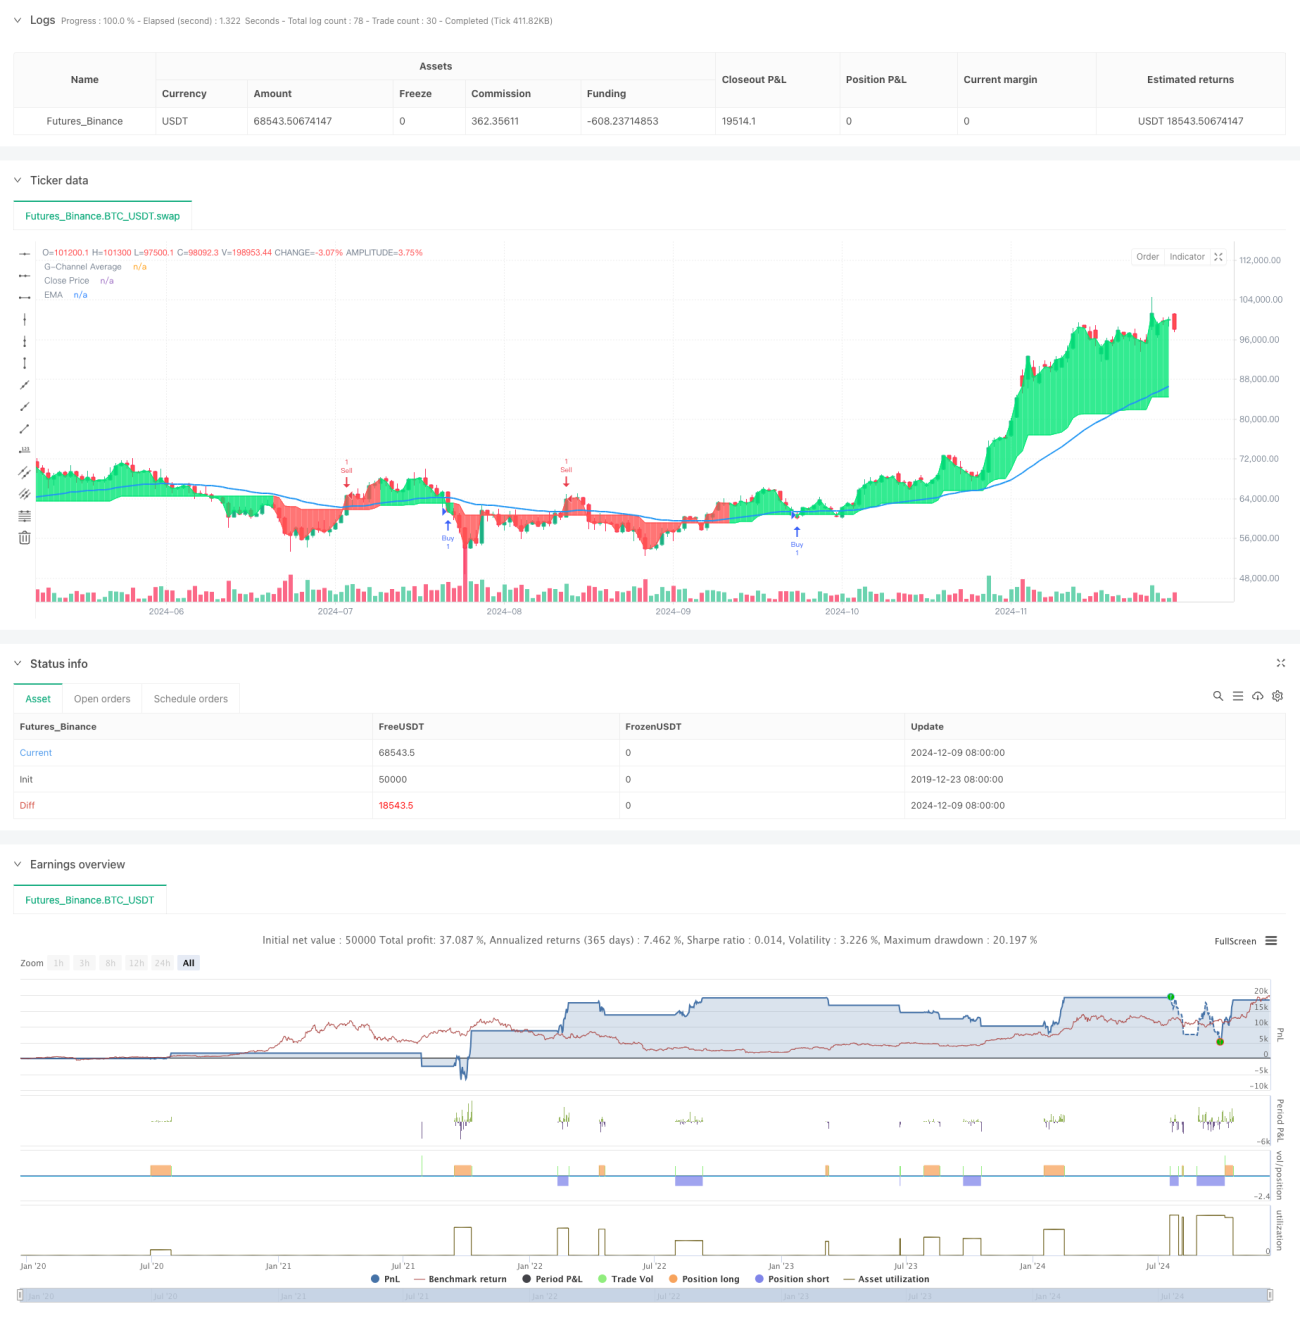
Die Strategie ist ein Multi-Indikator-Trading-System, das G-Channel, Index-Moving Averages, EMAs und reale Volatilität, ATRs kombiniert. Es identifiziert Handelssignale durch dynamische Unterstützung/Widerstands- und Trendbestätigung und verwaltet das Risiko mit ATR-basierten Stopps und Stopps. Das System wurde mit einem Fokus auf Zuverlässigkeit und Risikokontrolle entwickelt und ist für Trader geeignet, die eine robuste Handelsmethode suchen.
Strategieprinzip
Die Kernlogik der Strategie basiert auf folgenden wichtigen Komponenten:
- G-Kanal berechnet dynamische Unterstützungs- und Widerstandsniveaus, die durch mathematische Formeln kontinuierlich auf und ab angepasst werden
- EMAs werden verwendet, um die Richtung des Gesamttrends zu bestimmen, wobei die Position des Preises gegenüber der EMA die Richtung des Handels bestimmt
- Eingangssignale basieren auf Durchbruch des G-Kanals und EMA-Positionsbestätigung
- Stop und Stop mit ATR-Multiplikatoren, Stop mit 2-mal ATR und Stop mit 4-mal ATR
- Vermeiden Sie durch Status-Tracking die Wiederholung von Signalen
Strategische Vorteile
- Mehrstufige Signalbestätigungsmechanismen erhöhen die Zuverlässigkeit von Transaktionen
- Dynamisch angepasste Kanalgrenzen für unterschiedliche Marktumgebungen
- Risikomanagement basierend auf Volatilität ist flexibler
- Vermeidung von Wiederholungssignalen verringert das Risiko von Übertriebenen
- Sichtbare Kauf- und Verkaufsmarkierungen zur Analyse und Rückverfolgung
Strategisches Risiko
- In den OTC-Märkten könnte es zu viele falsche Durchbruchsignale geben.
- EMA als Rückstandsindikator könnte zu Verzögerungen bei der Eintrittszeit führen
- ATR-Stopps mit festen Multiplikatoren sind möglicherweise nicht flexibel genug für hohe Schwankungen
- Längere historische Daten für die Berechnung von Indikatoren
- Parameteroptimierung kann zu Überanpassung führen
Richtung der Strategieoptimierung
- Einführung von Signalen zur Übertragungsbestätigung, um die Zuverlässigkeit des Durchbruchs zu erhöhen
- Dynamische Anpassung der ATR-Multiplikatoren an unterschiedliche Marktschwankungen
- Hinzufügen von Marktumfeld-Filtern, um Geschäfte unter ungünstigen Bedingungen zu vermeiden
- Optimierte Signalfilterlogik, um Falschsignale weiter zu reduzieren
- Erwägen Sie ein dynamisches Positionsmanagementsystem
Zusammenfassen
Die Strategie baut ein vollständiges Handelssystem auf, indem sie mehrere bewährte technische Indikatoren kombiniert. Die Stärken des Systems liegen in seiner vielschichtigen Signalbestätigungsmechanik und der auf Volatilität basierenden Risikomanagement, jedoch muss die Strategie in der Praxis nach den spezifischen Markteigenschaften optimiert werden. Durch die empfohlene Optimierungsrichtung kann die Stabilität und Anpassungsfähigkeit der Strategie weiter verbessert werden.
- 1