
Die Strategie ist ein selbstanpassendes Trend-Tracking-System, das mehrere technische Indikatoren kombiniert. Es optimiert die Handelsperformance durch Multi-Zyklus-Analyse und dynamische Anpassung der Stop-Loss-Positions. Im Mittelpunkt der Strategie steht die Identifizierung von Trends durch ein Gleichgewichtssystem, die Bestätigung der Trendstärke über den RSI und den MACD und die Anpassung der Risikomanagementparameter an die ATR-Dynamik.
Die Strategie verwendet eine Dreifachprüfung, um den Handel zu betreiben: 1) die Richtung des Trends wird durch die Kreuzung der schnellen und langsamen EMAs beurteilt; 2) die Handelssignale werden durch die Verwendung von RSI-Über-Kauf-Verkauf-Ebenen und MACD-Trendbestätigungen gefiltert; 3) die Trendbestätigung durch die Einführung von EMAs mit höherer Zeitdauer. In Bezug auf die Risikokontrolle ermöglicht die Strategie eine anpassungsfähige Positionsverwaltung, die die Stop-Loss- und Gewinnziele an die ATR-Dynamik anpasst.
Es handelt sich um ein streng konzipiertes Trend-Tracking-System, das eine umfassende Handelslösung durch mehrschichtige Validierungsmechanismen und dynamisches Risikomanagement bietet. Die Kernvorteile der Strategie liegen in ihrer Anpassungsfähigkeit und Risikokontrolle, wobei jedoch auf die Optimierung der Parameter und die Anpassung an die Marktumgebung geachtet werden muss. Durch kontinuierliche Optimierung und Verbesserung wird die Strategie voraussichtlich in verschiedenen Marktumgebungen stabil bleiben.
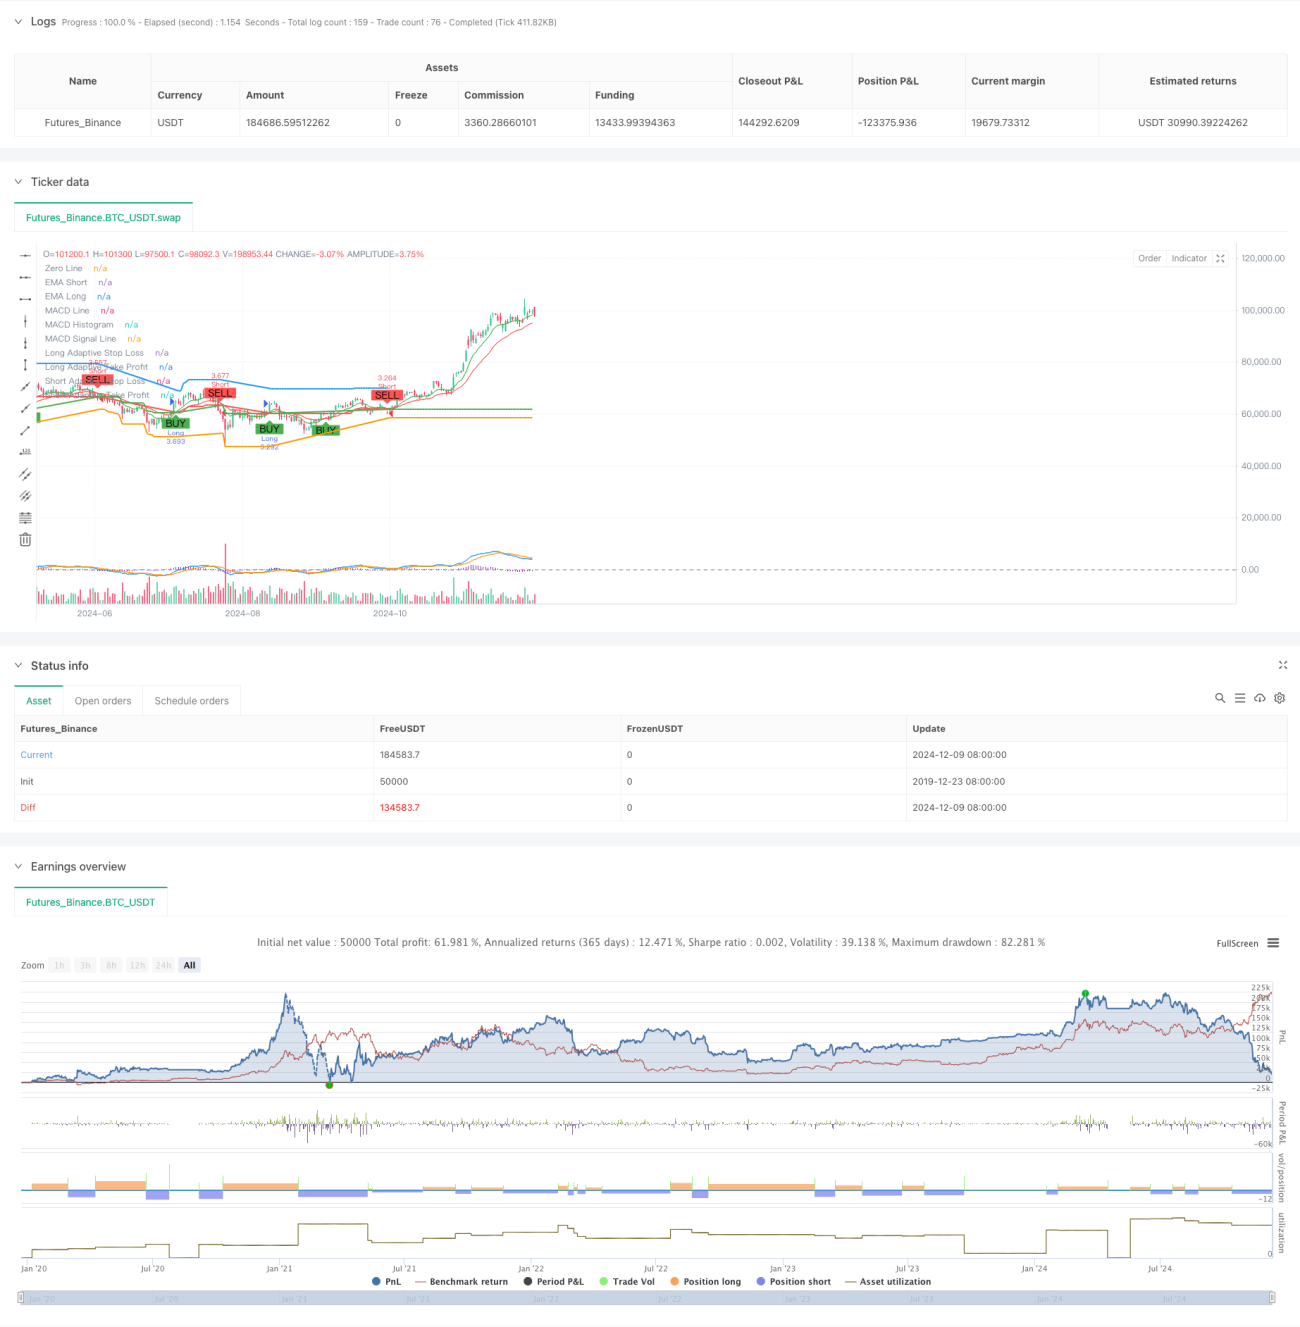
/*backtest
start: 2019-12-23 08:00:00
end: 2024-12-10 08:00:00
period: 1d
basePeriod: 1d
exchanges: [{"eid":"Futures_Binance","currency":"BTC_USDT"}]
*/
//@version=5
strategy("TrenGuard Adaptive ATR Strategy", overlay=true, default_qty_type=strategy.percent_of_equity, default_qty_value=100)
// Parameters
emaShortPeriod = input.int(9, title="Short EMA Period", minval=1)
emaLongPeriod = input.int(21, title="Long EMA Period", minval=1)
rsiPeriod = input.int(14, title="RSI Period", minval=1)
rsiOverbought = input.int(70, title="RSI Overbought", minval=50)
rsiOversold = input.int(30, title="RSI Oversold", minval=1)
atrPeriod = input.int(14, title="ATR Period", minval=1)
atrMultiplierSL = input.float(2.0, title="ATR Multiplier for Stop-Loss", minval=0.1)
atrMultiplierTP = input.float(2.0, title="ATR Multiplier for Take-Profit", minval=0.1)
// Multi-timeframe settings
htfEMAEnabled = input.bool(true, title="Use Higher Timeframe EMA Confirmation?", inline="htf")
htfEMATimeframe = input.timeframe("D", title="Higher Timeframe", inline="htf")
// MACD Parameters
macdShortPeriod = input.int(12, title="MACD Short Period", minval=1)
macdLongPeriod = input.int(26, title="MACD Long Period", minval=1)
macdSignalPeriod = input.int(9, title="MACD Signal Period", minval=1)
// Select trade direction
tradeDirection = input.string("Both", title="Trade Direction", options=["Both", "Long", "Short"])
// Calculating indicators
emaShort = ta.ema(close, emaShortPeriod)
emaLong = ta.ema(close, emaLongPeriod)
rsiValue = ta.rsi(close, rsiPeriod)
atrValue = ta.atr(atrPeriod)
[macdLine, macdSignalLine, _] = ta.macd(close, macdShortPeriod, macdLongPeriod, macdSignalPeriod)
// Higher timeframe EMA confirmation
htfEMALong = request.security(syminfo.tickerid, htfEMATimeframe, ta.ema(close, emaLongPeriod))
// Trading conditions
longCondition = ta.crossover(emaShort, emaLong) and rsiValue < rsiOverbought and (not htfEMAEnabled or close > htfEMALong) and macdLine > macdSignalLine
shortCondition = ta.crossunder(emaShort, emaLong) and rsiValue > rsiOversold and (not htfEMAEnabled or close < htfEMALong) and macdLine < macdSignalLine
// Initial Stop-Loss and Take-Profit levels based on ATR
var float adaptiveStopLoss = na
var float adaptiveTakeProfit = na
if (strategy.position_size > 0) // Long Position
if (longCondition) // Trend Confirmation
adaptiveStopLoss := na(adaptiveStopLoss) ? close - atrValue * atrMultiplierSL : math.max(adaptiveStopLoss, close - atrValue * atrMultiplierSL)
adaptiveTakeProfit := na(adaptiveTakeProfit) ? close + atrValue * atrMultiplierTP : math.max(adaptiveTakeProfit, close + atrValue * atrMultiplierTP)
else
adaptiveStopLoss := na(adaptiveStopLoss) ? close - atrValue * atrMultiplierSL : math.max(adaptiveStopLoss, close - atrValue * atrMultiplierSL)
adaptiveTakeProfit := na(adaptiveTakeProfit) ? close + atrValue * atrMultiplierTP : math.max(adaptiveTakeProfit, close + atrValue * atrMultiplierTP)
if (strategy.position_size < 0) // Short Position
if (shortCondition) // Trend Confirmation
adaptiveStopLoss := na(adaptiveStopLoss) ? close + atrValue * atrMultiplierSL : math.min(adaptiveStopLoss, close + atrValue * atrMultiplierSL)
adaptiveTakeProfit := na(adaptiveTakeProfit) ? close - atrValue * atrMultiplierTP : math.min(adaptiveTakeProfit, close - atrValue * atrMultiplierTP)
else
adaptiveStopLoss := na(adaptiveStopLoss) ? close + atrValue * atrMultiplierSL : math.min(adaptiveStopLoss, close + atrValue * atrMultiplierSL)
adaptiveTakeProfit := na(adaptiveTakeProfit) ? close - atrValue * atrMultiplierTP : math.min(adaptiveTakeProfit, close - atrValue * atrMultiplierTP)
// Strategy Entry
if (longCondition and (tradeDirection == "Both" or tradeDirection == "Long"))
strategy.entry("Long", strategy.long)
if (shortCondition and (tradeDirection == "Both" or tradeDirection == "Short"))
strategy.entry("Short", strategy.short)
// Strategy Exit
if (strategy.position_size > 0) // Long Position
strategy.exit("Exit Long", "Long", stop=adaptiveStopLoss, limit=adaptiveTakeProfit, when=shortCondition)
if (strategy.position_size < 0) // Short Position
strategy.exit("Exit Short", "Short", stop=adaptiveStopLoss, limit=adaptiveTakeProfit, when=longCondition)
// Plotting EMAs
plot(emaShort, title="EMA Short", color=color.green)
plot(emaLong, title="EMA Long", color=color.red)
// Plotting MACD
hline(0, "Zero Line", color=color.gray)
plot(macdLine - macdSignalLine, title="MACD Histogram", color=color.purple, style=plot.style_histogram)
plot(macdLine, title="MACD Line", color=color.blue)
plot(macdSignalLine, title="MACD Signal Line", color=color.orange)
// Plotting Buy/Sell signals with distinct colors
plotshape(series=longCondition, title="Buy Signal", location=location.belowbar, color=color.green, style=shape.labelup, text="BUY")
plotshape(series=shortCondition, title="Sell Signal", location=location.abovebar, color=color.red, style=shape.labeldown, text="SELL")
// Plotting Trailing Stop-Loss and Take-Profit levels with distinct colors
plot(strategy.position_size > 0 ? adaptiveStopLoss : na, title="Long Adaptive Stop Loss", color=color.red, linewidth=2, style=plot.style_line)
plot(strategy.position_size < 0 ? adaptiveStopLoss : na, title="Short Adaptive Stop Loss", color=color.green, linewidth=2, style=plot.style_line)
plot(strategy.position_size > 0 ? adaptiveTakeProfit : na, title="Long Adaptive Take Profit", color=color.blue, linewidth=2, style=plot.style_line)
plot(strategy.position_size < 0 ? adaptiveTakeProfit : na, title="Short Adaptive Take Profit", color=color.orange, linewidth=2, style=plot.style_line)
// Alert conditions for entry signals
alertcondition(longCondition and (tradeDirection == "Both" or tradeDirection == "Long"), title="Long Signal", message="Long signal triggered: BUY")
alertcondition(shortCondition and (tradeDirection == "Both" or tradeDirection == "Short"), title="Short Signal", message="Short signal triggered: SELL")
// Alert conditions for exit signals
alertcondition(strategy.position_size > 0 and shortCondition, title="Exit Long Signal", message="Exit long position: SELL")
alertcondition(strategy.position_size < 0 and longCondition, title="Exit Short Signal", message="Exit short position: BUY")
// Alert conditions for reaching take-profit levels
alertcondition(strategy.position_size > 0 and close >= adaptiveTakeProfit, title="Take Profit Long Signal", message="Take profit level reached for long position")
alertcondition(strategy.position_size < 0 and close <= adaptiveTakeProfit, title="Take Profit Short Signal", message="Take profit level reached for short position")