
Überblick
Die Strategie ist ein integriertes Handelssystem, das die Analyse von Relativ-Schwachen-Indikatoren (RSI), Moving Averages (MACD), Bollinger Bands (BB) und Volumen (Volume) kombiniert. Die Strategie wird durch die synchronisierte Kombination von mehrdimensionalen technischen Indikatoren verwendet, um eine umfassende Analyse von Markttrends, Volatilität und Volumen zu erstellen, um die besten Handelsmöglichkeiten zu finden.
Strategieprinzip
Die Kernlogik der Strategie basiert auf folgenden Aspekten:
- Der RSI ((14) wird verwendet, um zu überkaufen oder zu verkaufen, wenn der RSI unter 30 liegt.
- MACD ((12,26,9) wird verwendet, um die Richtung des Trends zu bestimmen, MACD Goldfork als Mehrfachsignal
- Die Effektivität der Preisbewegung wird durch die Berechnung der Differenz zwischen steigendem und sinkendem Volumen (Delta Volume) bestätigt.
- In Kombination mit Brin wird die Preisschwankung bewertet, um den Einstieg zu optimieren.
- Das System gibt ein optimales Kaufsignal, wenn der RSI-Überverkauf, der MACD-Goldfork und das Delta-Volumen positiv sind
- Wenn der MACD-Dot-Fork oder der RSI über 60 liegt, wird das System automatisch platziert, um das Risiko zu kontrollieren
Strategische Vorteile
- Multi-Meter-Cross-Verifizierung erhöht die Zuverlässigkeit von Handelssignalen
- Bestätigung der Effektivität von Preistrends durch die Analyse der Transaktionsmengen
- Die Option für die Art des Adaptive Moving Averages erhöht die Flexibilität der Strategie
- Risikokontrollmechanismen, einschließlich Stop-Loss- und Stop-Stop-Einstellungen
- Strategieparameter können optimiert und an unterschiedliche Marktbedingungen angepasst werden
Strategisches Risiko
- Eine Kombination aus mehreren Indikatoren kann zu Signalverzögerungen führen
- Falsche Signale könnten in den OTC-Märkten entstehen
- Übermäßige Parameteroptimierung kann zu Überanpassung führen
- Hochfrequente Transaktionen können zu höheren Transaktionskosten führen
- Bei starken Marktschwankungen könnte es zu einem größeren Rückzug kommen.
Richtung der Strategieoptimierung
- Einführung eines Anpassungsparametermechanismus, der die Parameter der Indikatoren dynamisch an die Marktlage anpasst
- Erhöhung der Trendstärkenfilter und Verringerung der Falschsignale in den Horizontalmärkten
- Optimierung der Stop-Loss-Stopp-Mechanismen und Verbesserung der Effizienz der Kapitalnutzung
- Einzug in die Volatilitätsfiltermechanismen, um Positionen in einem hohen Volatilitätsumfeld zu korrigieren
- Entwicklung eines intelligenten Vermögensverwaltungssystems für dynamische Positionskontrolle
Zusammenfassen
Es handelt sich um eine komplexe Handelsstrategie, die mehrere technische Indikatoren vereint und Marktchancen durch mehrdimensionale Analysen wie RSI, MACD und Transaktionsvolumen erfasst. Die Strategie ist stark anpassungsfähig und skalierbar und verfügt über einen ausgezeichneten Risikokontrollmechanismus. Durch kontinuierliche Optimierung und Verbesserung wird die Strategie unter verschiedenen Marktumständen stabil bleiben.
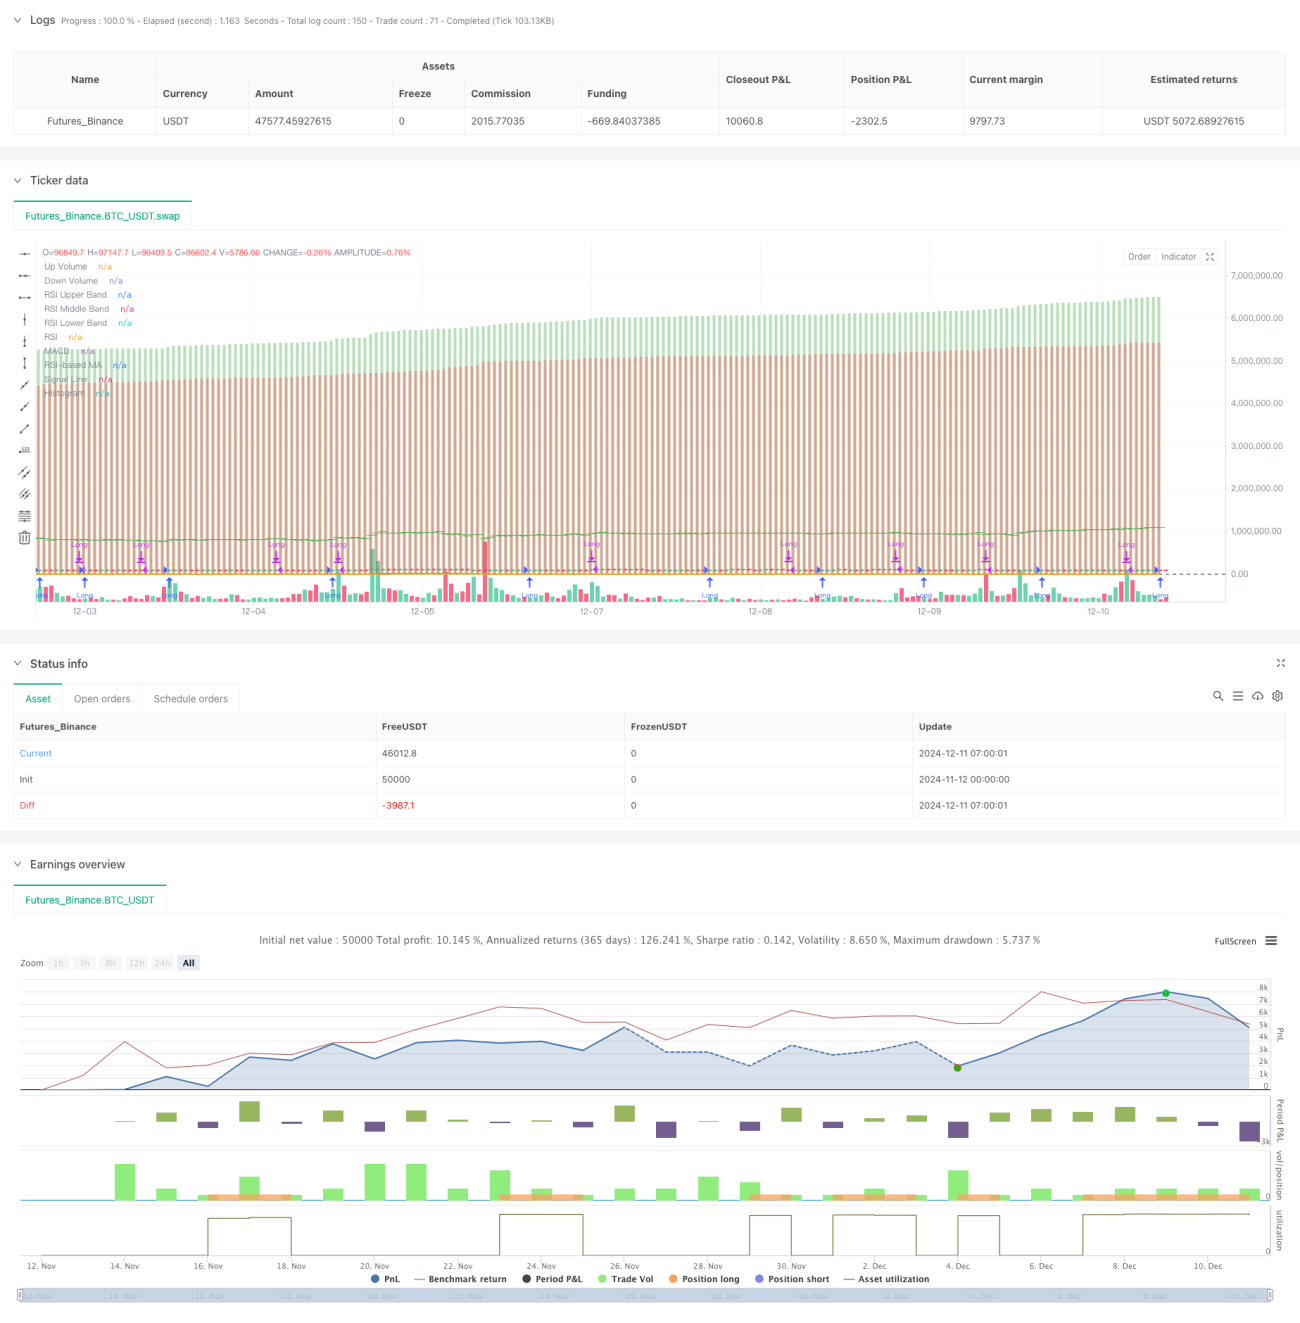
/*backtest
start: 2024-11-12 00:00:00
end: 2024-12-11 08:00:00
period: 1h
basePeriod: 1h
exchanges: [{"eid":"Futures_Binance","currency":"BTC_USDT"}]
*/

//@version=5
strategy("Liraz sh Strategy - RSI MACD Strategy with Bullish Engulfing and Net Volume", overlay=true, currency=currency.NONE, initial_capital=100000, commission_type=strategy.commission.percent, commission_value=0.1, slippage=3)

// Input parameters- 1