Dual Moving Average Stochastic Trend Following Handelsstrategie

Überblick
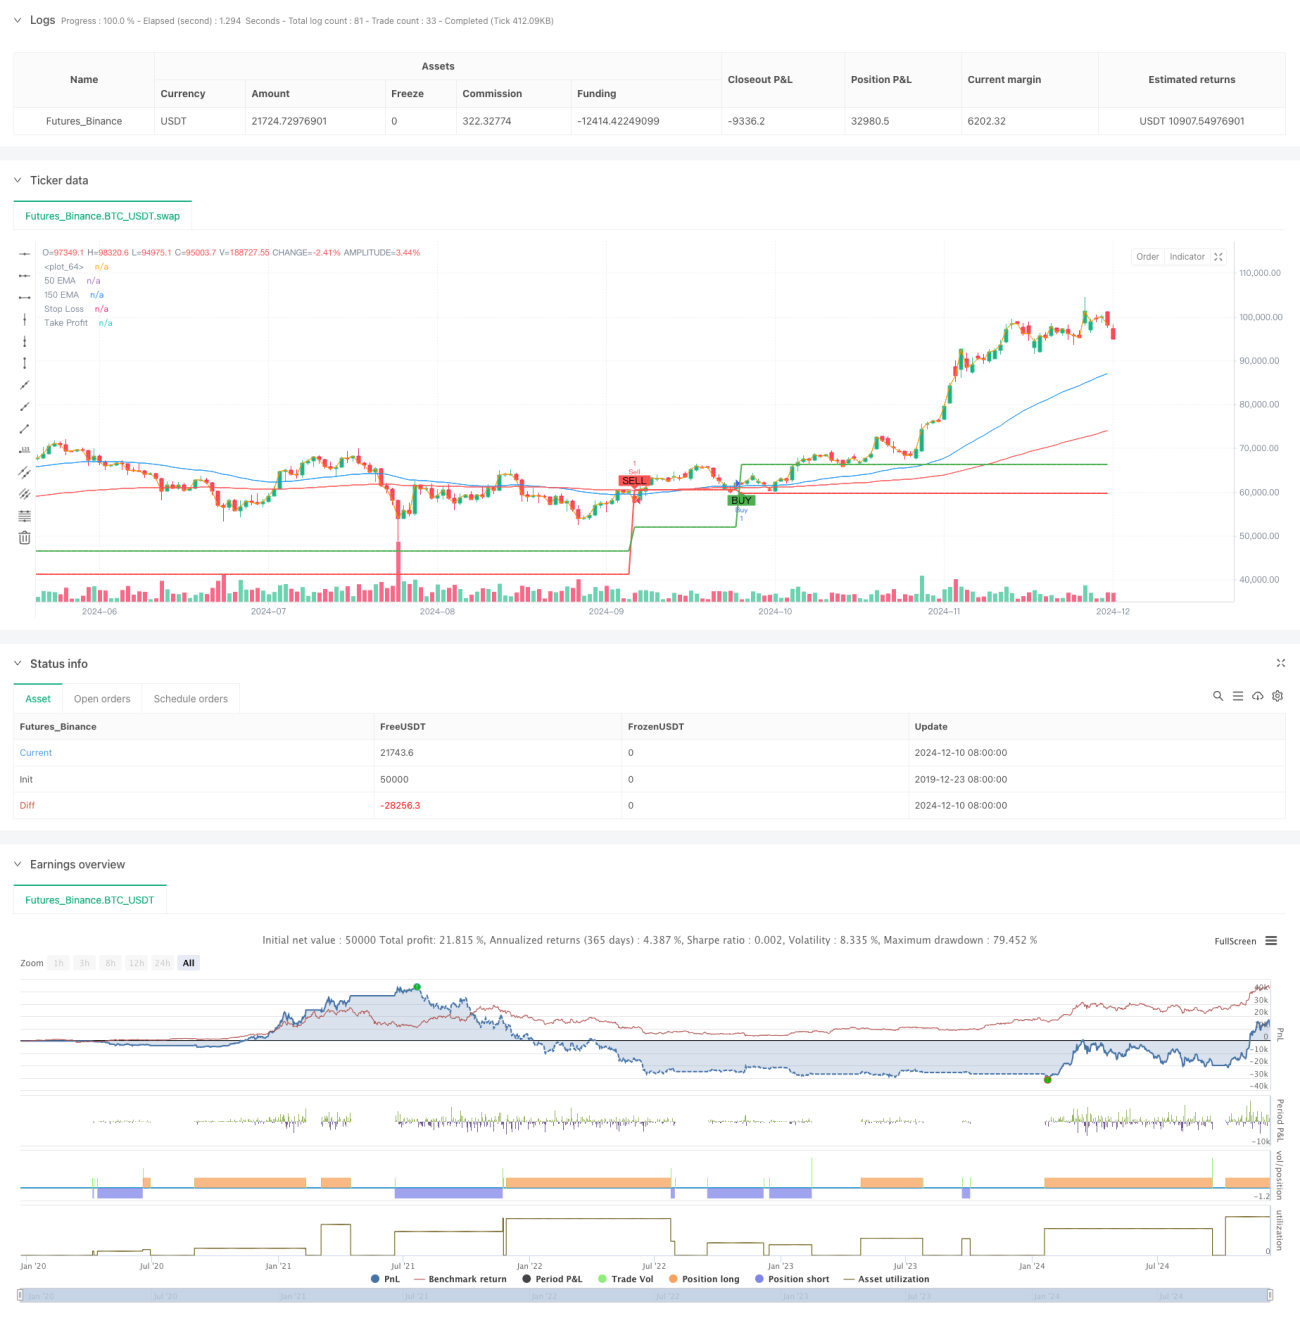
Die Strategie ist ein Trend-Tracking-Trading-System, das auf einer doppelten Mittellinie und einem Stochastic-Random-Indikator basiert. Es kombiniert eine Mittellinie mit einem Markttrend, während ein Cross-Signal in einem überkauften und überverkauften Bereich mit einem Random-Indikator erfasst wird. Es wird ein dynamischer Stop-Loss-Level festgelegt, um das Risiko zu kontrollieren.
Strategieprinzip
Die Strategie basiert auf folgenden Kernkomponenten:
- Die Richtung der Markttrends wird anhand der 50- und 150-Perioden-Indikatoren für Moving Averages (EMA) ermittelt
- Verwendung von Zufallsindikatoren ((14,3,3) zur Identifizierung von Überkauf- und Überverkaufszonen
- Kreuzung von Zufallsindikatoren in der Richtung des Trends
- Dynamische Stop-Loss-Positionen basierend auf den jüngsten Preisbewegungen
- Ein 1: 2 Risiko-Gewinn-Verhältnis mit einem Stop-Loss
Gleichzeitig müssen die Kaufbedingungen erfüllt sein:
- Die Schlusskosten lagen über dem 50-Tage-Mittelwert und dem 150-Tage-Mittelwert
- Die 50-tägige Durchschnittslinie liegt über der 150-tägigen Durchschnittslinie.
- Zufälliger K-Wert unter 30 und K-Linie über D-Linie nach oben
Die Bedingungen für den Verkauf sind umgekehrt:
- Der Abschluss liegt unter dem 50-Tage-Mittelwert und dem 150-Tage-Mittelwert
- Die 50-Tage-Mittellinie liegt unter der 150-Tage-Mittellinie.
- Zufälliger K-Wert über 70 und K-Linie über D-Linie nach unten
Strategische Vorteile
- Mehrfache Bestätigungsmechanismen verbessern die Verlässlichkeit
- Bestätigung der großen Trends durch ein mittleres Liniensystem
- Falschsignale mit Zufallsindikatoren filtern
- Ein Signal muss mehrere Bedingungen erfüllen, um ausgelöst zu werden.
- Gute Risikomanagementsysteme
- Dynamische Stop-Loss basierend auf den jüngsten Unterstützungsresistenzen
- Fixed-Risk-Ertrag gegenüber optimierten Erwartungen
- Trends bestätigen sich bei der Verringerung der Gefahr von False Breaches
- Äußerst anpassungsfähig
- Kann für mehrere Zeitspannen verwendet werden
- Die Parameter können an die Merkmale des Marktes angepasst werden
- Für einen volatilen Markt geeignet
Strategisches Risiko
- Schwache Marktentwicklung
- Häufige Durchbruch der Mittellinie führt zu falschen Signalen
- Es wird empfohlen, Trends zu verwenden.
- Verbesserte Trendfilter
- Stop-Loss-Risiken
- Überspannung kann zu häufigen Ausfällen führen
- Das Unternehmen könnte größere Verluste erleiden.
- Anpassung an Marktschwankungen
- Rückstandsrisiken
- Einheitliche Linien sind rückständig
- Vielleicht haben wir den Anfang der Tendenz verpasst
- Vorsicht bei der Wahl der Eintrittszeit
Richtung der Strategieoptimierung
- Zunahme der Trendstärke
- Hinzufügen von ADX-Indikatoren zur Messung der Trendstärke
- Setzen Sie die Mindesttrendstärken-Schwelle
- Vermeiden Sie den Handel in schwachen Trends
- Optimierung der Parameter für die Zufallsmessung
- Anpassung der Parameter an die Merkmale des Marktes
- Erwägen Sie die Verwendung von Anpassungsparametern
- Hinzufügen von anderen technischen Kennzahlen
- Verbesserte Schadensbegrenzung
- Erwägen Sie die Verwendung von Tracking Stop Loss
- Anpassung an die Dynamik der Volatilität
- Optimierung der Risikogewinn-Verhältnis-Einstellungen
Zusammenfassen
Es ist ein vollständiges Strategie-System, das Trend-Tracking und Dynamik-Trading kombiniert. Durch die Kombination von Gleichlinien-System und Zufallsindikatoren ist es möglich, sowohl die Handelsrichtung in Übereinstimmung mit dem Haupttrend zu gewährleisten, als auch in der richtigen Preiszone zu handeln. Die Strategie enthält auch ein ausgefeiltes Risikomanagement-Mechanismus, um das Risiko mit dynamischen Stop-Loss- und festen Risiko-Gewinn-Verhältnissen zu kontrollieren.
- 1