Doppelt exponentieller gleitender Durchschnitt und Relative Strength Index Crossover-Strategie

Überblick
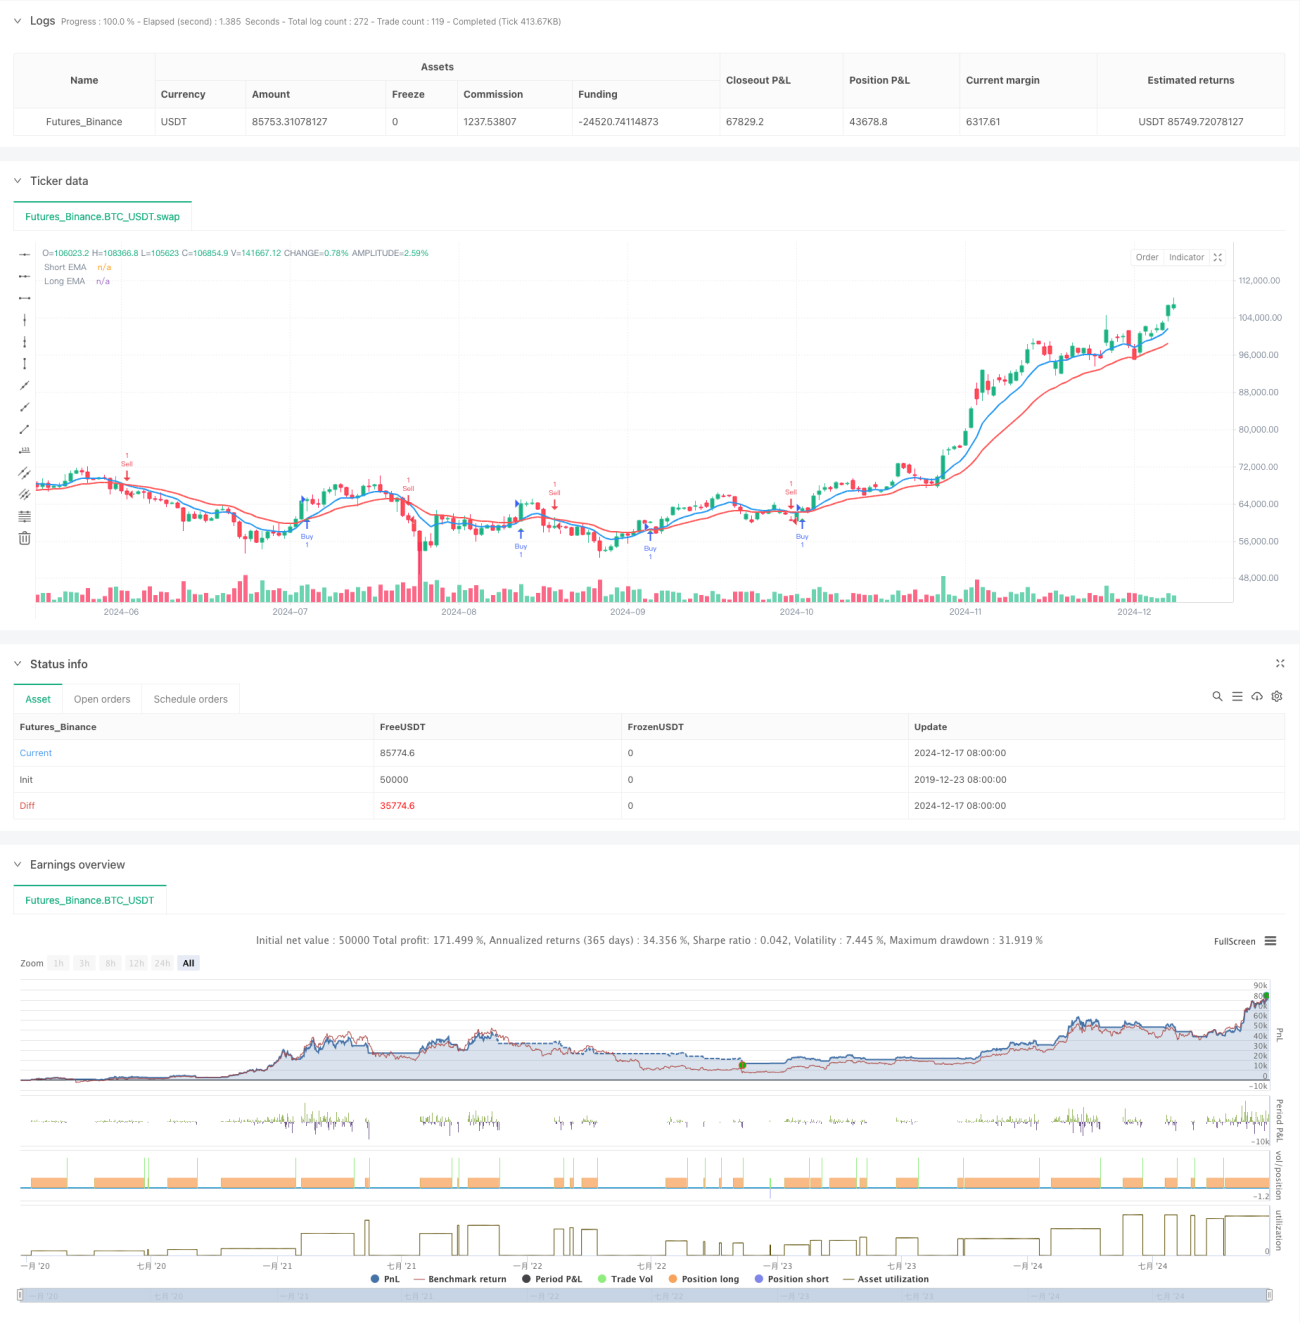
Die Strategie ist ein Trend-Tracking-Trading-System, das einen binären Index-Moving Average (EMA) und einen relativ starken Index (RSI) kombiniert. Die Strategie läuft auf einem 5-Minuten-Zeitrahmen und fängt Markttrends durch die Kreuzung von kurz- und langfristigen EMAs sowie die Kombination mit dem RSI-Indikator ein, während ein Stop-Loss mit einem festen Prozentsatz eingesetzt wird.
Strategieprinzip
Die Strategie basiert auf folgenden Kernkomponenten:
- Trendrichtung mit einem Doppel-EMA-System mit 9 und 21 Zyklen
- Trendbestätigung durch den RSI über 14 Zyklen
- Wenn die kurzfristige EMA die langfristige EMA nach oben durchquert und der RSI größer als 50 ist, wird ein Mehrwertsignal erzeugt
- Kurzfristige EMAs erzeugen ein Broker-Signal, wenn sie die langfristigen EMAs nach unten überschreiten und der RSI kleiner als 50 ist
- Setzen Sie 1.5% Stop-Loss und 0.5% Stop-Loss, um Ihr Risiko zu verwalten
Strategische Vorteile
- Das Signalsystem ist robust: Die Doppelbestätigung in Kombination mit dem Trendindikator (EMA) und dem Dynamikindikator (RSI) kann falsche Signale wirksam reduzieren
- Gute Risikomanagement: Stop-Loss mit festen Anteilen, um die Risiken für jeden Handel zu kontrollieren
- Klarheit der Handelslogik: Eintritts- und Ausstiegsbedingungen sind klar und leicht zu verstehen und auszuführen
- Anpassungsfähigkeit: Anpassung an unterschiedliche Marktbedingungen durch Parameteroptimierung
Strategisches Risiko
- Schwankungsrisiko: Häufige falsche Durchbruchsignale in schwankenden Märkten
- Schlupfrisiko: Hochfrequente Transaktionen mit 5-Minuten-Zyklen können einen größeren Schlupf erwarten
- Fixed-Stop-Risiko: Prozentsatz, bei dem Fixed-Stop-Risiken bei größerer Volatilität leicht ausgelöst werden können
- Trendwechselrisiko: Bei einem plötzlichen Trendwechsel kann es zu einem größeren Rückzug kommen
Richtung der Strategieoptimierung
- Dynamische Stop-Loss-Optimierung: Erwägen Sie die Einführung von ATR-Indikatoren, die die Stop-Loss-Position dynamisch anpassen
- Filterung der Marktumgebung: Hinzufügen von Volatilitätsindikatoren zur Auswahl der geeigneten Handelsumgebung
- Optimierung der Positionsverwaltung: Dynamische Positionsverwaltung auf Basis von Volatilität und Risikometern
- Optimierung der Handelszeiten: Analyse der Performance für verschiedene Zeiträume, Optimierung der Handelszeitenfenster
Zusammenfassen
Es ist ein vollständiges Handelssystem, das technische Indikatoren und Risikomanagement kombiniert. Die Strategie identifiziert Trends effektiv durch die Kombination von EMA und RSI und kontrolliert die Risiken durch die Verwendung von festen Stop-Losses. Obwohl es einige Einschränkungen gibt, kann die Stabilität und Profitabilität der Strategie durch die empfohlene Optimierungsrichtung weiter verbessert werden.
- 1