Trendverfolgung über mehrere Zeitrahmen und ATR-Stop-Profit- und Stop-Loss-Strategie

ATR EMA
Erstellungsdatum: 2024-12-20 14:14:32 zuletzt geändert: 2024-12-20 14:14:32
Kopie: 0 Klicks: 431
1
konzentrieren Sie sich auf
1617
Anhänger

Trendverfolgung über mehrere Zeitrahmen und ATR-Stop-Profit- und Stop-Loss-Strategie

Überblick

Dies ist eine Trend-Tracking-Trading-Strategie, die den UT Bot mit einem 50-Zyklus-Index-Moving Average (EMA) kombiniert. Die Strategie handelt hauptsächlich in 1-Minuten-Zeitspannen und verwendet 5-Minuten-Zeitspannen als Richtungsfilter. Die Strategie verwendet den ATR-Indikator, um die Stop-Loss-Position dynamisch zu berechnen, und setzt ein doppeltes Stop-Goal, um den Gewinn zu optimieren.

Strategieprinzip

Die Kernlogik der Strategie basiert auf den folgenden Schlüsselkomponenten:

  1. Mit dem UT Bot berechnen Sie die Widerstandswerte für die dynamische Unterstützung
  2. 50 Perioden EMAs mit 5-Minuten-Perioden zur Bestimmung der Gesamttrendrichtung
  3. In Kombination mit einem 21-Zyklus-EMA und einem UT-Bot-Signal wird ein spezifischer Einstiegspunkt festgelegt.
  4. Dynamische Tracking-Stopp-Verluste durch ATR-Multiplier
  5. Setzen Sie zwei Stop-Loss-Ziele von 0,5% und 1%, um jeweils 50% der Positionen zu platzieren

Wenn der Preis die von der UT Bot berechnete Unterstützung/Widerstandslage durchbricht und die 21-Zyklus-EMA mit der UT Bot kreuzt, wird ein Handelssignal ausgelöst, wenn der Preis sich in der richtigen Richtung der 5-minütigen 50-Zyklus-EMA befindet.

Strategische Vorteile

  1. Mehrfache Zeiträume verbunden mit höherer Zuverlässigkeit der Transaktionen
  2. Dynamische ATR-Stopps können an Marktschwankungen angepasst werden
  3. Doppel-Stop-Ziel: Gewinn und Gewinnquote im Gleichgewicht
  4. Mit Hilfe der Heikin Ashi-Filterkarte kann ein Teil des falschen Durchbruchs gefiltert werden.
  5. Unterstützt flexible Handelsprozesse (einfach zu viel, einfach zu wenig oder in beide Richtungen)

Strategisches Risiko

  1. Kurzfristige Transaktionen können mit höheren Spreads und Gebühren verbunden sein.
  2. Häufige Falschsignale in der Querkorrektur
  3. Die Einschränkung von mehreren Bedingungen kann dazu führen, dass potenzielle Handelschancen verpasst werden.
  4. Die Einstellungen für die ATR-Parameter müssen für verschiedene Märkte optimiert werden

Richtung der Strategieoptimierung

  1. Umsatzindikatoren können als zusätzliche Bestätigung hinzugefügt werden
  2. Erwägen Sie die Einführung von mehr Market Sentiment Indicators
  3. Entwicklung von Adaptionsparametern für unterschiedliche Marktschwankungen
  4. Filter für zusätzliche Transaktionszeiten
  5. Entwicklung eines intelligenten Lagerverwaltungssystems

Zusammenfassen

Die Strategie baut durch die Kombination von mehreren technischen Indikatoren und Zeiträumen ein vollständiges Handelssystem auf. Es enthält nicht nur klare Ein- und Ausstiegsbedingungen, sondern bietet auch eine solide Risikomanagement-Mechanismus. Obwohl in der praktischen Anwendung noch Parameter-Optimierung nach den spezifischen Marktsituationen erforderlich ist, ist das gesamte Framework sehr praktisch und erweiterbar.
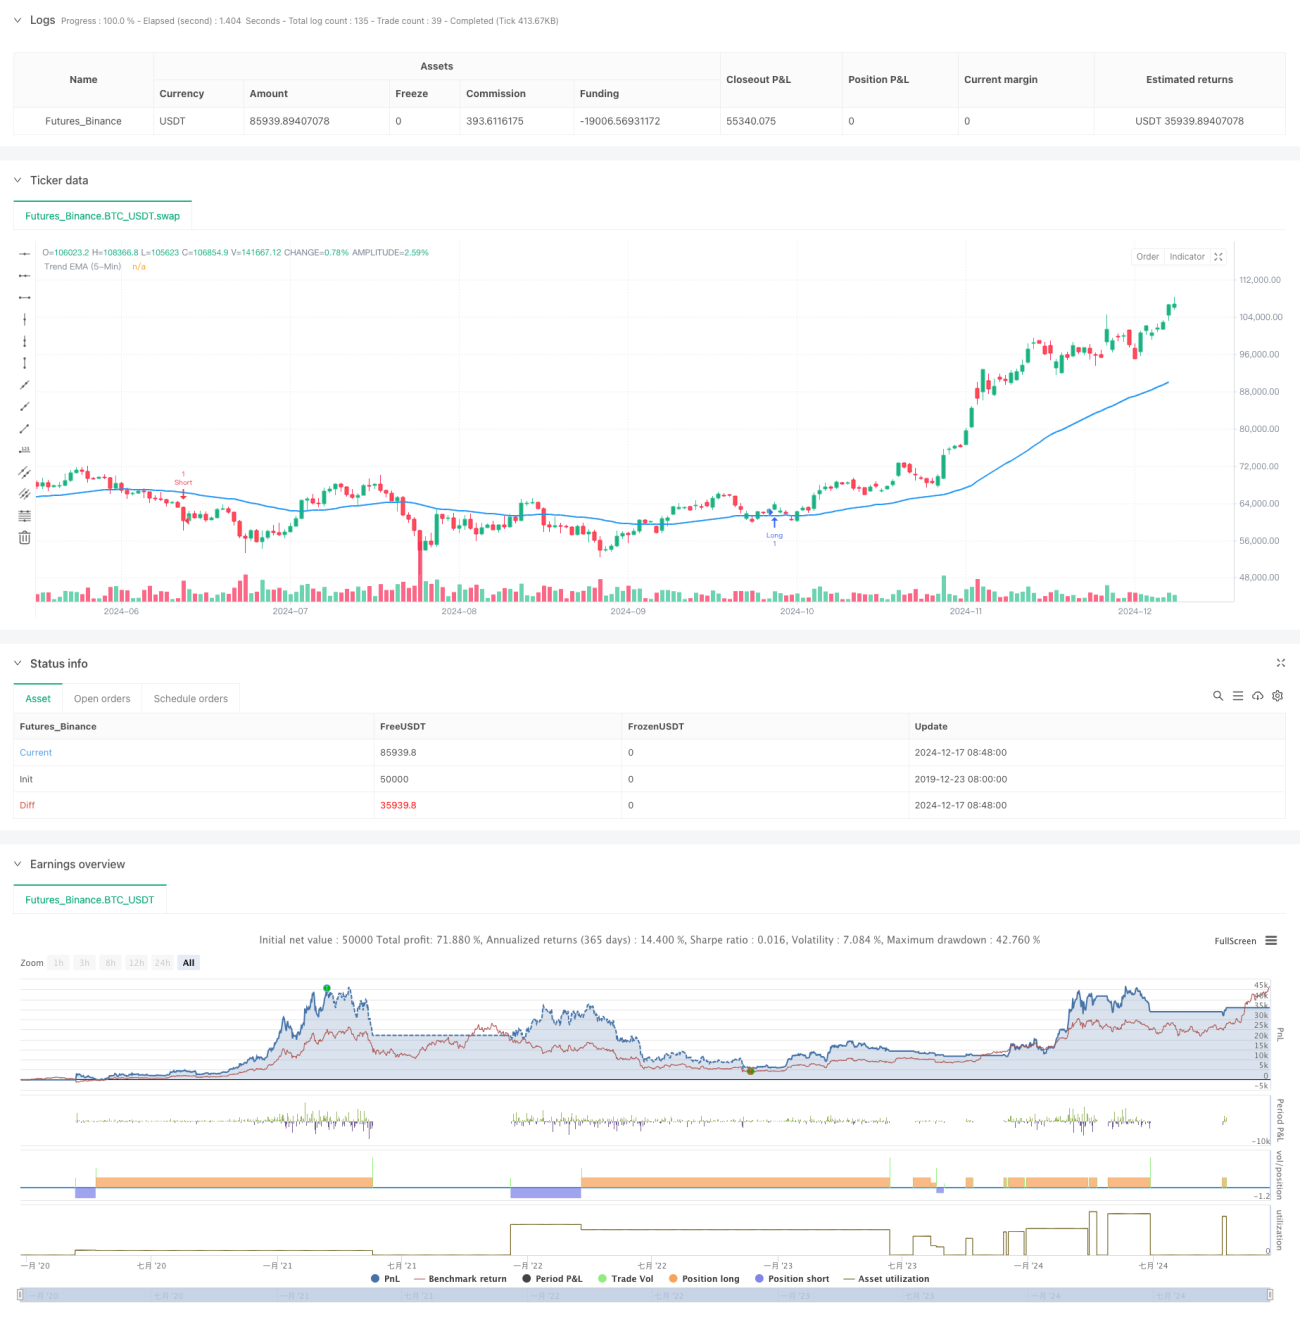
Strategiequellcode
/*backtest
start: 2019-12-23 08:00:00
end: 2024-12-18 08:00:00
period: 1d
basePeriod: 1d
exchanges: [{"eid":"Futures_Binance","currency":"BTC_USDT"}]
*/

//@version=5
//Created by Nasser mahmoodsani' all rights reserved
// E-mail : [email protected]

strategy("UT Bot Strategy with T/P and S/L and Trend EMA", overlay=true)

// Inputs
along = input(1, title='Key Value (Sensitivity - Long)', group="LONG")
clong = input(10, title='ATR Period (Long)', group="LONG")
h = input(true, title='Signals from Heikin Ashi Candles')
ashort = input(7, title='Key Value (Sensitivity - Short)', group="SHORT")
cshort = input(2, title='ATR Period (Short)', group="SHORT")
tradeType = input.string("Both", title="Trade Type", options=["Buy Only", "Sell Only", "Both"])
tp1_percent = input.float(0.5, title="TP1 Percentage", step=0.1, group="TP Settings") // TP1 % input
tp2_percent = input.float(1.0, title="TP2 Percentage", step=0.1, group="TP Settings") // TP2 % input
sl_percent = input.float(1.0, title="Stop Loss Percentage", step=0.1, group="TP Settings") // SL % input
sl_in_percent = input(true, title="Use Stop Loss in Percentage", group="TP Settings")
tp1_qty = input.float(0.5, title="Take Profit 1 Quantity (as % of position size)", minval=0.0, maxval=1.0, step=0.1)
tp2_qty = input.float(0.5, title="Take Profit 2 Quantity (as % of position size)", minval=0.0, maxval=1.0, step=0.1)

// Check that total quantities for TPs do not exceed 100%
if tp1_qty + tp2_qty > 1
    runtime.error("The sum of Take Profit quantities must not exceed 100%.")

// Calculate 50 EMA from 5-Minute Timeframe
trendEmaPeriod = 50
trendEma_5min = request.security(syminfo.tickerid, "5", ta.ema(close, trendEmaPeriod))
plot(trendEma_5min, title="Trend EMA (5-Min)", color=color.blue, linewidth=2)

// Calculations 
xATRlong = ta.atr(clong)
xATRshort = ta.atr(cshort)
nLosslong = along * xATRlong
nLossshort = ashort * xATRshort

src = h ? request.security(ticker.heikinashi(syminfo.tickerid), timeframe.period, close) : close

// LONG
var float xATRTrailingStoplong = na
var float stopLossLong = na
var float takeProfit1 = na
var float takeProfit2 = na

iff_1long = src > nz(xATRTrailingStoplong[1], 0) ? src - nLosslong : src + nLosslong
iff_2long = src < nz(xATRTrailingStoplong[1], 0) and src[1] < nz(xATRTrailingStoplong[1], 0) ? math.min(nz(xATRTrailingStoplong[1]), src + nLosslong) : iff_1long
xATRTrailingStoplong := src > nz(xATRTrailingStoplong[1], 0) and src[1] > nz(xATRTrailingStoplong[1], 0) ? math.max(nz(xATRTrailingStoplong[1]), src - nLosslong) : iff_2long

buy = src > xATRTrailingStoplong and ta.crossover(ta.ema(src, 21), xATRTrailingStoplong) and close > trendEma_5min

if buy and (tradeType == "Buy Only" or tradeType == "Both")
    takeProfit1 := close * (1 + tp1_percent / 100)
    takeProfit2 := close * (1 + tp2_percent / 100)

    // Calculate stop loss based on percentage or ATR
    if sl_in_percent
        stopLossLong := close * (1 - sl_percent / 100)
    else
        stopLossLong := close - nLosslong

    strategy.entry("Long", strategy.long)
    strategy.exit("Take Profit 1", from_entry="Long", limit=takeProfit1, qty=strategy.position_size * tp1_qty)
    strategy.exit("Take Profit 2", from_entry="Long", limit=takeProfit2, qty=strategy.position_size * tp2_qty)
    strategy.exit("Stop Loss", from_entry="Long", stop=stopLossLong, qty=strategy.position_size)

    // // Create Position Projectile for Long
    // var line tpLineLong1 = na
    // var line tpLineLong2 = na
    // var line slLineLong = na
    // var label entryLabelLong = na

    // // Update projectile on entry
    // line.delete(tpLineLong1)
    // line.delete(tpLineLong2)
    // line.delete(slLineLong)
    // label.delete(entryLabelLong)

    // tpLineLong1 := line.new(x1=bar_index, y1=takeProfit1, x2=bar_index + 1, y2=takeProfit1, color=color.green, width=2, style=line.style_solid)
    // tpLineLong2 := line.new(x1=bar_index, y1=takeProfit2, x2=bar_index + 1, y2=takeProfit2, color=color.green, width=2, style=line.style_dashed)
    // slLineLong := line.new(x1=bar_index, y1=stopLossLong, x2=bar_index + 1, y2=stopLossLong, color=color.red, width=2, style=line.style_solid)

// SHORT
var float xATRTrailingStopshort = na
var float stopLossShort = na
var float takeProfit1Short = na
var float takeProfit2Short = na

iff_1short = src > nz(xATRTrailingStopshort[1], 0) ? src - nLossshort : src + nLossshort
iff_2short = src < nz(xATRTrailingStopshort[1], 0) and src[1] < nz(xATRTrailingStopshort[1], 0) ? math.min(nz(xATRTrailingStopshort[1]), src + nLossshort) : iff_1short
xATRTrailingStopshort := src > nz(xATRTrailingStopshort[1], 0) and src[1] > nz(xATRTrailingStopshort[1], 0) ? math.max(nz(xATRTrailingStopshort[1]), src - nLossshort) : iff_2short

sell = src < xATRTrailingStopshort and ta.crossover(xATRTrailingStopshort, ta.ema(src, 21)) and close < trendEma_5min

if sell and (tradeType == "Sell Only" or tradeType == "Both")
    takeProfit1Short := close * (1 - tp1_percent / 100)
    takeProfit2Short := close * (1 - tp2_percent / 100)

    // Calculate stop loss based on percentage or ATR
    if sl_in_percent
        stopLossShort := close * (1 + sl_percent / 100)
    else
        stopLossShort := close + nLossshort

    strategy.entry("Short", strategy.short)
    strategy.exit("Take Profit 1 Short", from_entry="Short", limit=takeProfit1Short, qty=strategy.position_size * tp1_qty)
    strategy.exit("Take Profit 2 Short", from_entry="Short", limit=takeProfit2Short, qty=strategy.position_size * tp2_qty)
    strategy.exit("Stop Loss Short", from_entry="Short", stop=stopLossShort, qty=strategy.position_size)

    // Create Position Projectile for Short
    // var line tpLineShort1 = na
    // var line tpLineShort2 = na
    // var line slLineShort = na
    // var label entryLabelShort = na

    // // Update projectile on entry
    // line.delete(tpLineShort1)
    // line.delete(tpLineShort2)
    // line.delete(slLineShort)
    // label.delete(entryLabelShort)

    // tpLineShort1 := line.new(x1=bar_index, y1=takeProfit1Short, x2=bar_index + 1, y2=takeProfit1Short, color=color.green, width=2, style=line.style_solid)
    // tpLineShort2 := line.new(x1=bar_index, y1=takeProfit2Short, x2=bar_index + 1, y2=takeProfit2Short, color=color.green, width=2, style=line.style_dashed)
    // slLineShort := line.new(x1=bar_index, y1=stopLossShort, x2=bar_index + 1, y2=stopLossShort, color=color.red, width=2, style=line.style_solid)

// Updating Stop Loss after hitting Take Profit 1
if buy and close >= takeProfit1
    strategy.exit("Adjusted Stop Loss", from_entry="Long", stop=close)

// Updating Stop Loss after hitting Take Profit 1 for Short
if sell and close <= takeProfit1Short
    strategy.exit("Adjusted Stop Loss Short", from_entry="Short", stop=close)