
Überblick
Die Strategie basiert auf einer Kombination aus mehreren technischen Indikatoren. Die Strategie verwendet EMA-Kreuzungen als Kernsignal, in Kombination mit SMA, VWAP, um die Trendrichtung zu bestätigen, und filtert die Signale mit MACD und RSI als Hilfsindikatoren. Die Strategie verwendet das Risikomanagement an festen Stopppositionen, um die Erfolgsrate des Handels durch strenge Einstiegsbedingungen und Positionsmanagement zu erhöhen.
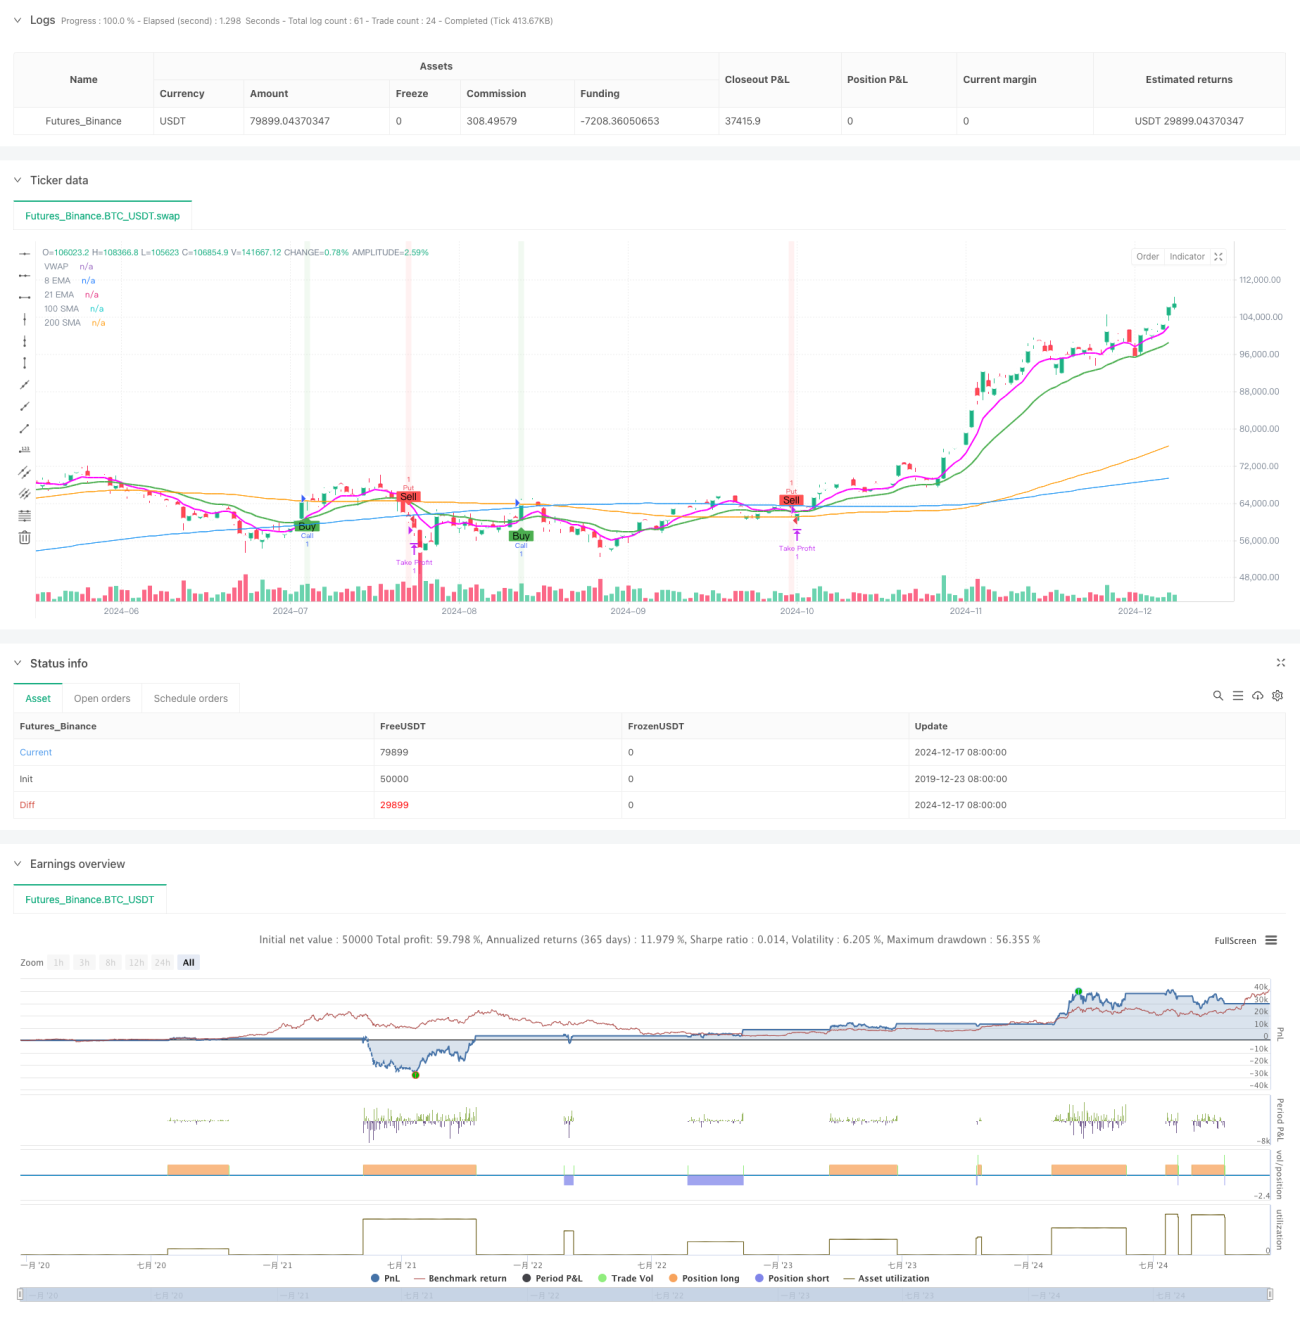
Strategieprinzip
Die Strategie verwendet die Kreuzung der 8- und 21-Zyklus-EMA als Haupthandelssignal und löst mehrere Signale aus, wenn die kurzfristige EMA über die langfristige EMA fällt und die folgenden Bedingungen erfüllt werden: Der Preis liegt über dem 100- und 200-Zyklus-SMA, die MACD-Linie über der Signallinie, der RSI ist größer als 50. Die Triggerbedingungen für das Leerlaufsignal sind umgekehrt. Die Strategie führt VWAP als Preisgewichtungsreferenz ein, um die relative Position des aktuellen Preises zu bestimmen.
Strategische Vorteile
- Mehrere Kennzahlen sind synchronisiert und erhöhen die Zuverlässigkeit des Signals durch die Überprüfung verschiedener Perioden und Typen von Kennzahlen
- Die Kombination von Trend-Tracking und Dynamik-Indikatoren wird verwendet, um sowohl Trends als auch kurzfristige Dynamik zu erfassen.
- Fixed Stop-Points helfen, Gewinne zu schützen und übermäßige Gier zu vermeiden
- Strenge Lagerhaltung, um Wiederholungen zu vermeiden und Risiken zu reduzieren
- Klare Visualisierung mit EMA-, SMA- und VWAP-Bewegungen sowie Signalmarkierungen
Strategisches Risiko
- In volatilen Märkten können häufig Fehlsignale auftreten
- Fixed Stop-Points können zu verpassten Gewinnchancen führen
- Keine Stop-Loss-Einstellung, die in extremen Situationen zu hohen Verlusten führen kann
- Die Verwendung mehrerer Indikatoren kann zu Signalverzögerungen führen
- In Optionen mit geringer Liquidität kann ein Slippage-Risiko auftreten
Richtung der Strategieoptimierung
- Einführung eines adaptiven Stop-Loss-Mechanismus, der sich an die dynamischen Marktschwankungen anpasst
- Erweiterung des Moduls für die Verwaltung von Volumen und dynamische Anpassung der Positionen an die Größe der Konten und die Marktbedingungen
- Hinzufügen eines Marktfluktuationsfilters zur Anpassung der Strategieparameter in einer Umgebung mit hoher Fluktuation
- Optimierung der Kennzahlenparameter, wobei der Einsatz von Adaptionszyklen anstelle von Fixzyklen in Betracht gezogen werden kann
- Hinzufügen von Zeitfiltern, um den Handel in Zeiten mit hoher Volatilität wie Marktöffnungen und -schließungen zu vermeiden
Zusammenfassen
Es handelt sich um eine strukturierte, logisch eindeutige, mehrindikatorische Trend-Tracking-Optionshandelsstrategie. Die Strategie verbessert die Zuverlässigkeit der Handelssignale durch die synchronisierte Kombination mehrerer technischer Indikatoren und verwaltet das Risiko durch die Verwendung von festen Stop-Points. Obwohl die Strategie einige inhärente Risiken birgt, kann die Stabilität und Profitabilität der Strategie durch die vorgeschlagene Optimierungsrichtung weiter verbessert werden. Die visuelle Gestaltung der Strategie hilft auch dem Händler, die Handelssignale intuitiv zu verstehen und auszuführen.
/*backtest
start: 2019-12-23 08:00:00
end: 2024-12-18 08:00:00
period: 1d
basePeriod: 1d
exchanges: [{"eid":"Futures_Binance","currency":"BTC_USDT"}]
*/

//@version=5
strategy("OptionsMillionaire Strategy with Take Profit Only", overlay=true, default_qty_type=strategy.fixed, default_qty_value=1)

// Define custom magenta color- 1