
Übersicht
Diese Strategie ist ein umfassendes Handelssystem, das mehrere technische Indikatoren kombiniert. Es erfasst Handelsmöglichkeiten, indem es dynamisch die Marktmoment- und Trendveränderungen überwacht. Die Strategie integriert mehrere Indikatoren wie gleitende Durchschnitte (EMA), Relative Stärke Index (RSI), Moving Average Convergence Divergence (MACD) und Bollinger Bänder (BB) und führt einen dynamischen Stop-Loss-Mechanismus basierend auf dem Average True Range (ATR) ein, um eine mehrdimensionale Marktanalyse und Risikokontrolle zu ermöglichen.
Strategieprinzip
Die Strategie verwendet ein mehrstufiges Signalbestätigungssystem, das hauptsächlich die folgenden Aspekte umfasst:
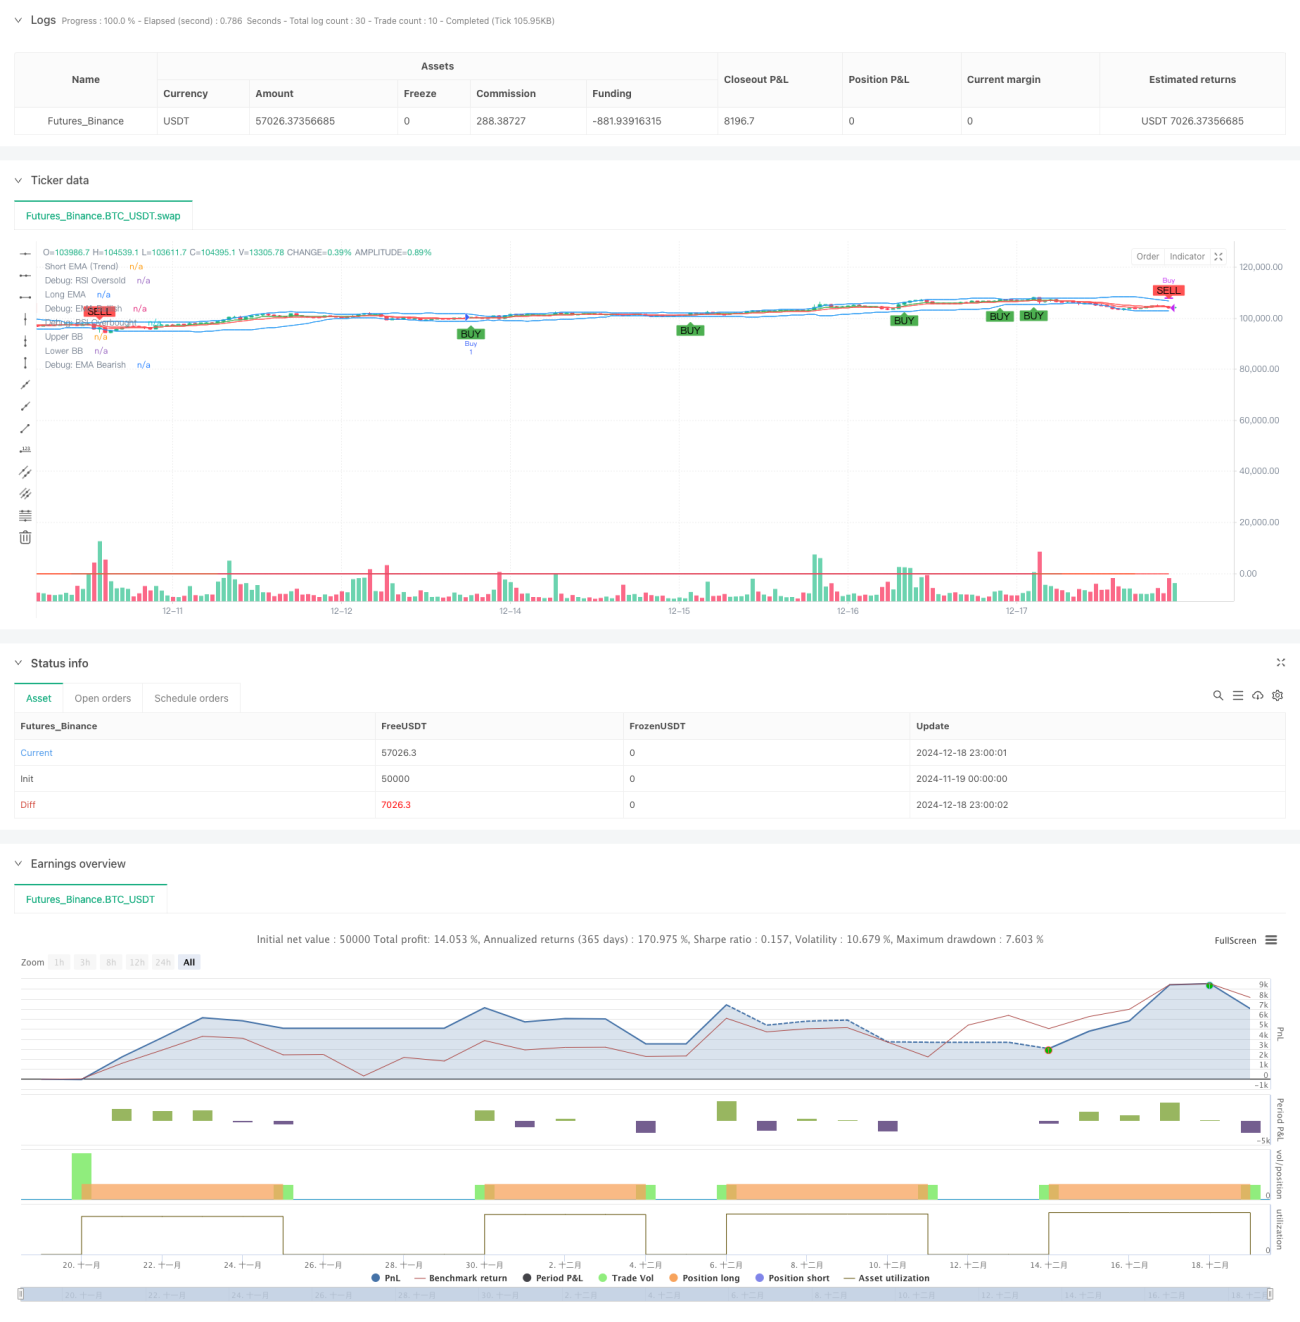
- Trendbestimmung: Verwendung des Crossoverns von 7-Perioden- und 14-Perioden-EMA zur Bestimmung der Marktrichtung.
- Momentumanalyse: Überwachung überkaufter/überverkaufter Zustände mit dem RSI-Indikator unter Verwendung dynamischer Schwellenwerte von 30/70.
- Trendstärkebestätigung: Einführung des ADX-Indikators zur Bewertung der Trendstärke – ein starker Trend wird bestätigt, wenn ADX > 25.
- Volatilitätsbereichsbestimmung: Nutzung von Bollinger Bändern zur Abgrenzung des Preisvolatilitätsbereichs; Handelssignale entstehen in Verbindung mit Berührungen der Bänder.
- Volumenbestätigung: Verwendung eines dynamischen Volumengleitenden-Durchschnitts-Filters, um sicherzustellen, dass der Handel bei ausreichender Marktaktivität stattfindet.
- Risikokontrolle: Dynamischer Stop-Loss basierend auf dem ATR-Indikator, wobei der Stop-Loss-Abstand das 1,5-fache des ATR beträgt.
Strategievorteile
- Mehrdimensionale Signalbestätigung reduziert effektiv Fehlsignale.
- Dynamischer Stop-Loss-Mechanismus verbessert die Risikoanpassungsfähigkeit.
- Kombination von Volumen- und Trendstärkeanalyse erhöht die Zuverlässigkeit des Handels.
- Flexible Indikatorparameter bieten gute Anpassungsfähigkeit.
- Vollständige Ein- und Ausstiegsmechanismen mit klarer Handelslogik.
- Verwendung standardisierter technischer Indikatoren – leicht verständlich und wartbar.
Strategierisiken
- Mehrere Indikatoren können zu Signalverzögerungen führen.
- Parameteroptimierung birgt das Risiko von Overfitting.
- In Seitwärtsmärkten können häufige Trades ausgelöst werden.
- Komplexe Signalsysteme erhöhen die Rechenlast.
- Erfordert eine ausreichende Stichprobengröße zur Validierung der Strategieeffektivität.
Optimierungsrichtungen
- Einführung eines Marktvolatilitätsanpassungsmechanismus zur dynamischen Optimierung der Indikatorparameter.
- Hinzufügen eines Zeitfilters, um Handel in ungünstigen Zeiträumen zu vermeiden.
- Optimierung der Take-Profit-Strategie, z. B. durch einen nachziehenden Take-Profit.
- Berücksichtigung von Transaktionskosten zur Optimierung von Ein- und Ausstiegsbedingungen.
- Einführung eines Positionsmanagements zur dynamischen Anpassung der Positionsgröße.
Zusammenfassung
Durch die synergistische Kombination mehrerer Indikatoren baut diese Strategie ein recht vollständiges Handelssystem auf. Der Kernvorteil liegt in der mehrdimensionalen Signalbestätigung und dem dynamischen Risikokontrollsystem. Gleichzeitig sind jedoch Parameteroptimierung und Marktanpassungsfähigkeit zu beachten. Durch kontinuierliche Optimierung und Anpassung kann die Strategie unter verschiedenen Marktbedingungen eine stabile Performance erzielen.
- 1