
Überblick
Die Strategie ist ein Mean-Return-Trading-System, das Bollinger Bands und einen relativ starken RSI kombiniert. Die Strategie identifiziert Extreme, bei denen der Preis vom Mittelwert abweicht, und kombiniert die RSI mit einem Überkauf-Überverkauf-Signal, um den Zeitpunkt des Handels zu bestimmen.
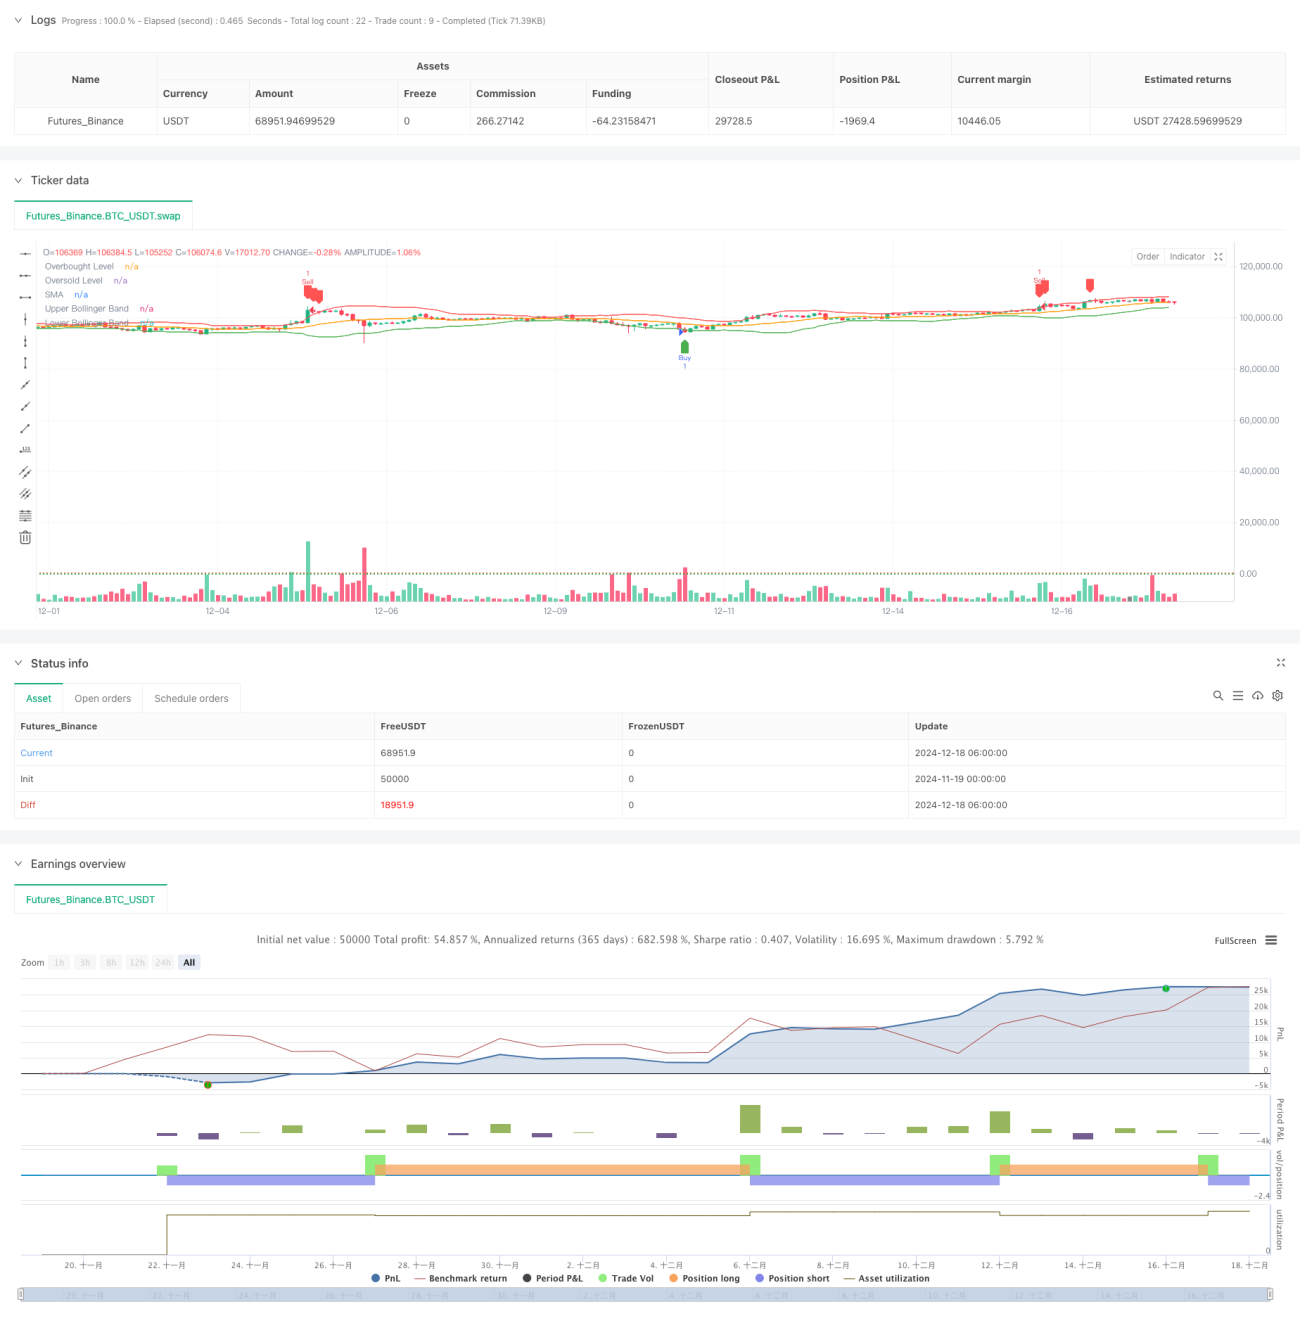
Strategieprinzip
Die Kernlogik der Strategie basiert auf der Mittelwert-Rücklauf-Eigenschaft der Finanzmärkte. Bei der konkreten Implementierung wird der 20-Tage-Simple Moving Average (SMA) als Mittelwert-Referenz verwendet, wobei die Standarddifferenzmenge 2.0 für die Berechnung der Brin-Bandbreite verwendet wird. Der 14-Tage-RSI wird als Hilfsindikator eingeführt, wobei 70 und 30 als Überkauf-Überverkauf-Schwellenwerte festgelegt werden. Die Strategie löst nur dann ein Handelssignal aus, wenn der Preis die Brin-Band durchbricht und der RSI die Extreme erreicht.
Strategische Vorteile
- Mehrfache technische Indikatoren, um zuverlässigere Handelssignale zu liefern
- Durch den RSI in Verbindung mit Brin-Bändern wirksame Filterung von Falschbrüchen
- Die Parameter sind hochgradig anpassbar, um sich an unterschiedliche Marktumgebungen anzupassen
- Strategie ist klar, leicht zu verstehen und umzusetzen
- Gute Risikokontrollmechanismen
- Code ist einfach und effizient zu pflegen und zu optimieren
Strategisches Risiko
- In einem Trendmarkt kann es zu häufigen vorgezogenen Positionen kommen, die sich auf die Erträge auswirken.
- Fehlgewählte Parameter können zu Signallager führen
- Bei starken Marktschwankungen könnte es zu einem größeren Rückzug kommen.
- Die Auswirkungen der Transaktionskosten auf die Strategierendite müssen berücksichtigt werden
- Unterschiedliche Strategien in unterschiedlichen Marktumgebungen
Richtung der Strategieoptimierung
- Einführung einer adaptiven Brin-Bandbreite, die sich an die dynamischen Marktschwankungen anpasst
- Erhöhung der Trendfilter und Verringerung der Handelsfrequenz in stark trendigen Märkten
- Optimierung der RSI-Parameter und Berücksichtigung der Verwendung von Adaptionszyklen
- Ein Stop-Loss-Stopp-Mechanismus, der die Risiko-Gewinn-Relation verbessert
- Erwägen Sie die Einführung von Verkehrsmesswerten, um die Signalsicherheit zu verbessern
- Entwicklung eines Parameter-Optimierungsmoduls zur automatischen Optimierung von Strategien
Zusammenfassen
Die Strategie baut durch die Synergie von Brin-Band und RSI ein robustes Mean-Return-Trading-System auf. Die Strategie ist vernünftig konzipiert, hat eine gute Skalierbarkeit und Anpassungsfähigkeit. Durch kontinuierliche Optimierung und Verbesserung kann die Stabilität und Profitabilität der Strategie weiter verbessert werden.
- 1