Überblick
Die Strategie ist ein Trendwechsel-Trading-System, das einen Index-Moving Average (EMA) und einen relativ starken Indikator (RSI) kombiniert. Durch die Kreuzung von 9- und 21-Zyklus-EMA-Signalen, die mit dem RSI-Indikator bei einem Durchbruch auf der Ebene von 50 bestätigt werden, werden den Händlern genaue Trendwechselpunkte bereitgestellt. Das System ist mit einem vollständigen Risikokontrollmechanismus ausgestattet, der eine feste Stop-Loss-Ratio beinhaltet, um die Rücknahme effektiv zu steuern.
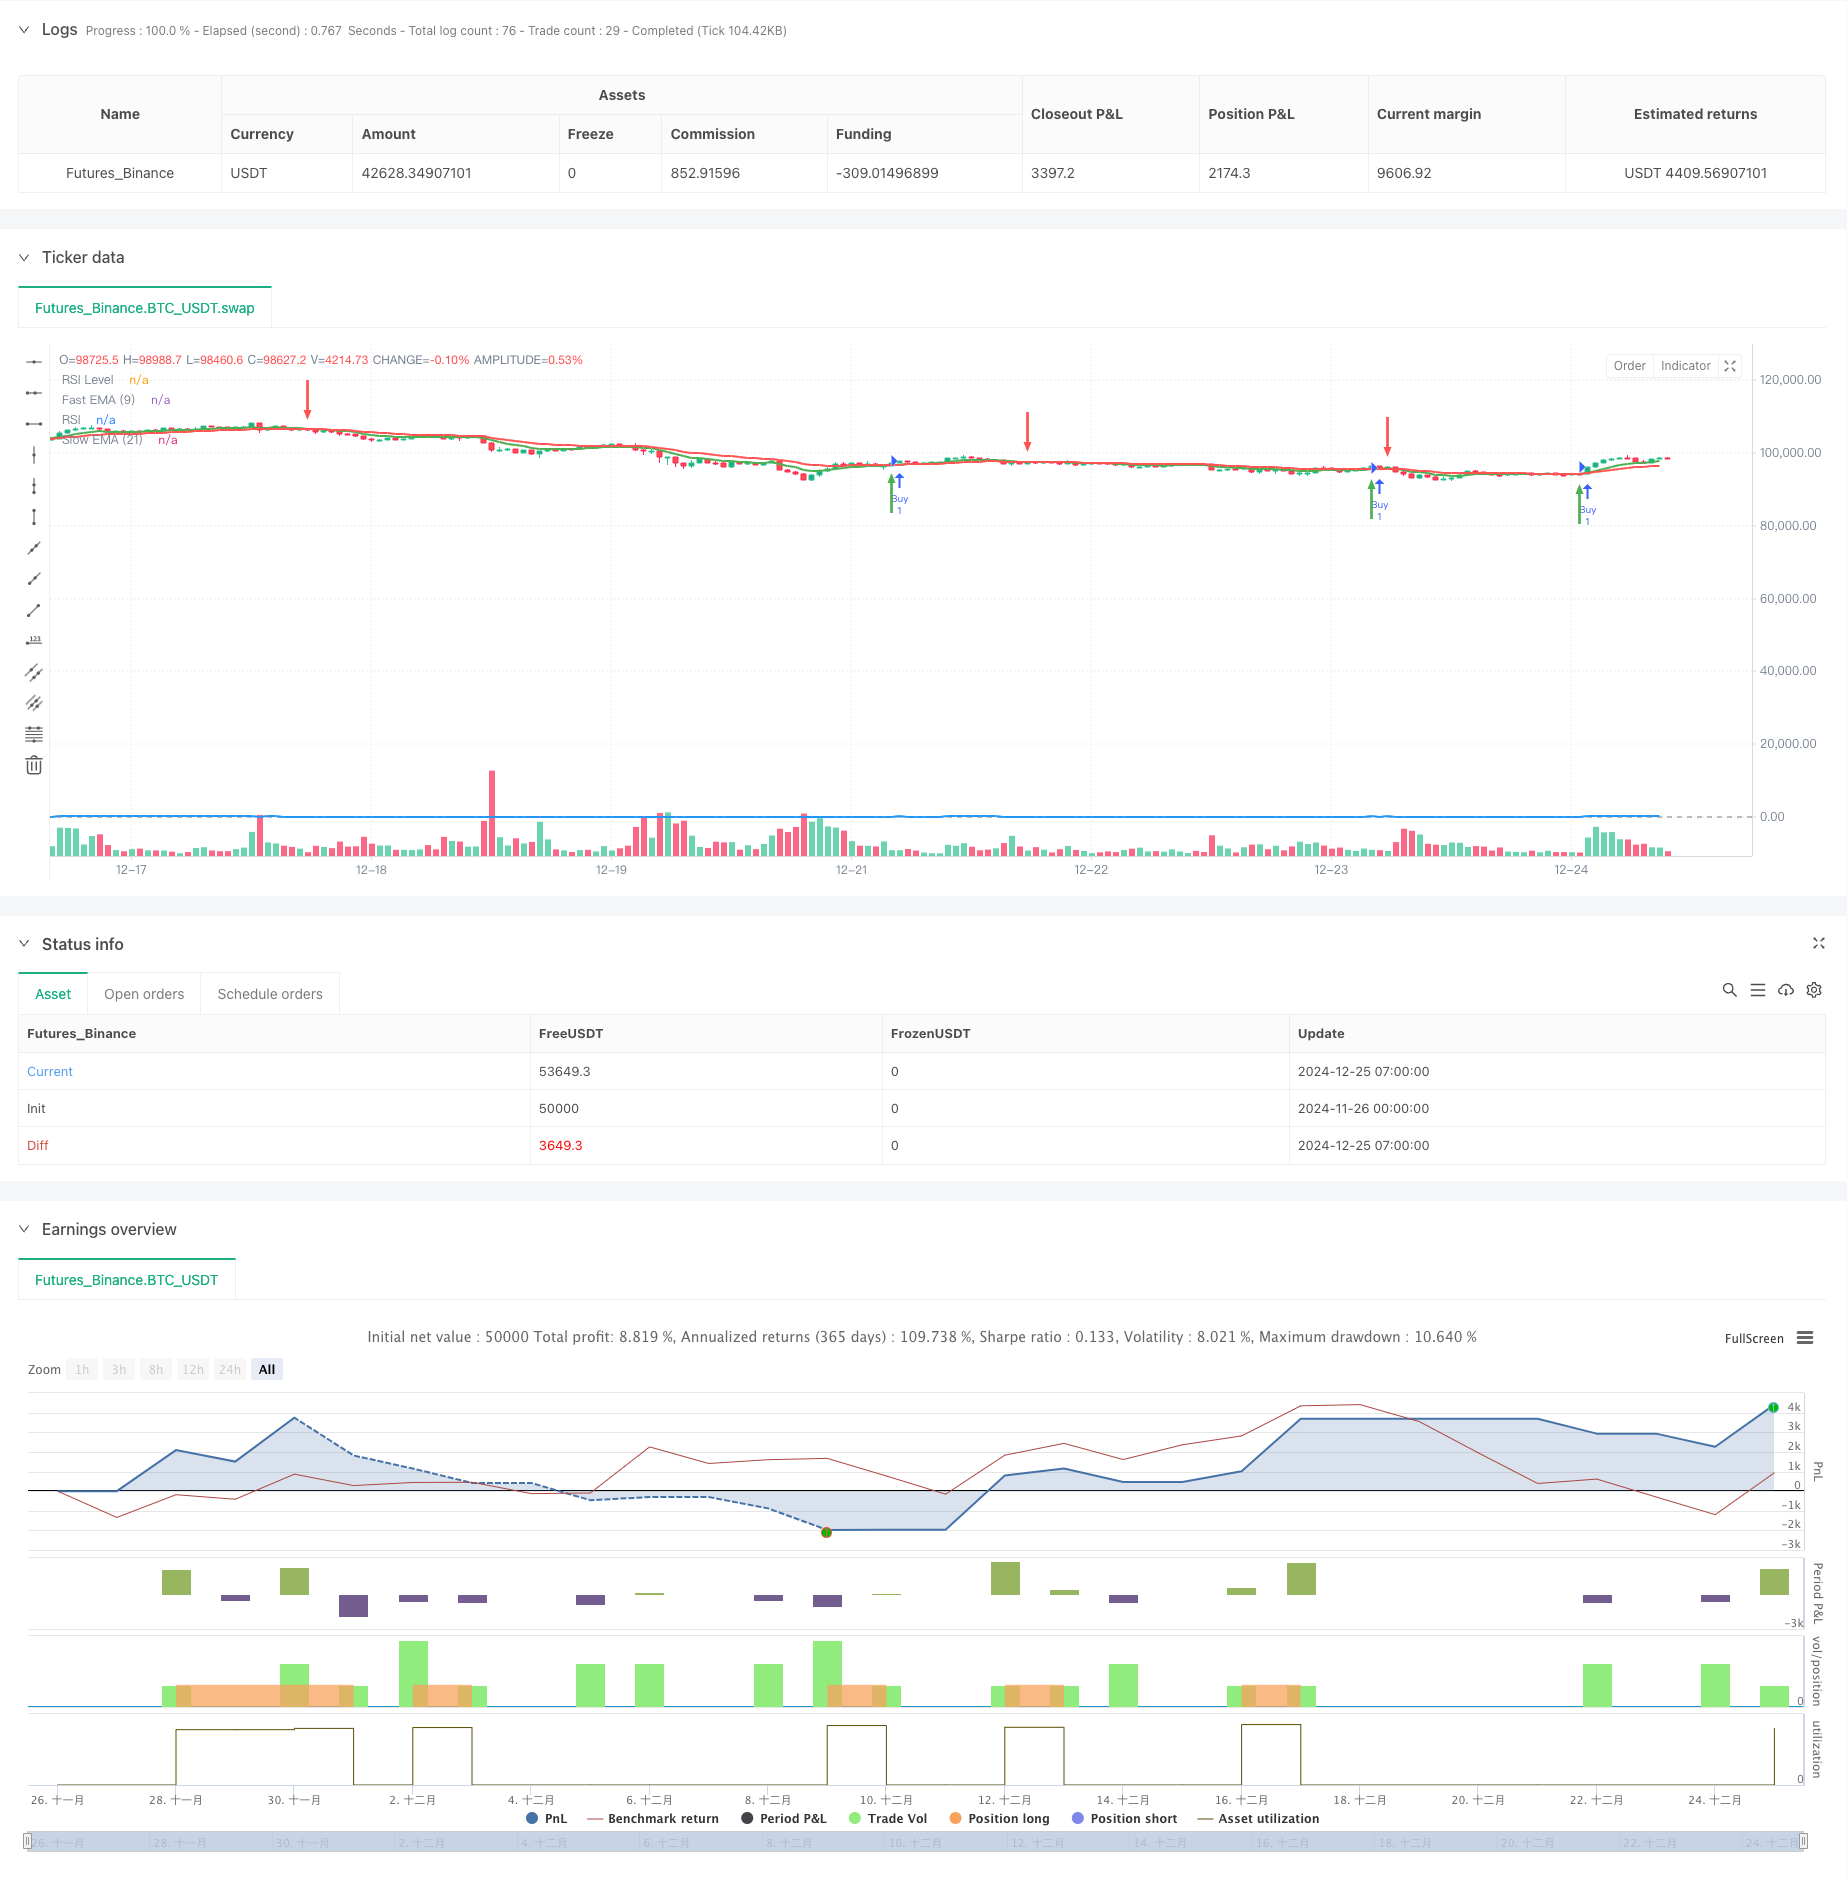
Strategieprinzip
Die Kernlogik der Strategie basiert auf der Kreuzung von schnellen EMA (Zyklus 9) und langsamen EMA (Zyklus 21) und der Dynamikbestätigung mit dem RSI-Indikator. Wenn ein schneller EMA nach oben durchschreitet einen langsamen EMA, während der RSI größer als 50 ist, gibt das System mehrere Signale aus. Wenn ein schneller EMA nach unten durchschreitet einen langsamen EMA, während der RSI kleiner als 50 ist, gibt das System ein Gleichgewichtssignal.
Strategische Vorteile
- Dual-Confirmation-Mechanismus: Durch EMA-Kreuzung und RSI-Bestätigung kombiniert, reduziert die Wahrscheinlichkeit von Falschsignalen erheblich
- Klar sichtbar: Die Kauf- und Verkaufspunkte werden mit grünen und roten Pfeilen markiert, die Handelssignale sind intuitiv klar
- Gute Risikomanagement: eingebaute Stop-Loss-Funktion, mit der sich die Risikogewinn-Risiko-Relation flexibel an Marktschwankungen anpassen lässt
- Anpassungsfähigkeit: Die Kernparameter sind anpassungsfähig, um sich an verschiedene Marktumgebungen und Handelsarten anzupassen
- Einfache Ausführung: klare Handelsregeln für die Implementierung automatisierter Handelssysteme
Strategisches Risiko
- Schlechte Effektivität der Horizontalmärkte: Häufige Falschsignale bei Zwischenwellen
- Rückstandsrisiko: Der Moving Average hat eine gewisse Rückstandsfähigkeit und kann die beste Einstiegsmomente verpassen
- RSI-Fehler: In extremen Situationen kann der RSI ein irreführendes Signal erzeugen
- Parameter-Sensitivität: Parameter können in unterschiedlichen Marktumgebungen angepasst werden, was die Kosten für die Strategie erhöht Lösung: Die Verwendung in einem klaren Marktumfeld wird empfohlen, wobei ein Fluktuationsfilter durch Hinzufügen des ATR-Kennzeichens und die Beurteilung von Trends in Verbindung mit einem längeren Zeitraum vorgenommen werden kann.
Richtung der Strategieoptimierung
- Einführung eines Volatilitätsfilters: Hinzufügen von ATR-Indikatoren, um den Handel bei geringer Volatilität zu beenden
- Optimierung des Stop-Losses: Erwägen Sie die Verwendung von dynamischen Stop-Losses wie Tracking-Stops oder ATR-basierte Stop-Loss-Einstellungen
- Erhöhung der Trendstärke-Filterung: Einführung von Trendindikatoren für längere Zeiträume, die nur in Richtung des Haupttrends handeln
- Verbesserte Transaktionsmengenbestätigung: Empfehlung zur Hinzufügung von Transaktionsmengenanalysen zur Erhöhung der Signalsicherheit
- Klassifizierung der Marktumgebung: Parameter können an die Dynamik der verschiedenen Marktumgebungen angepasst werden, um die Anpassungsfähigkeit der Strategie zu verbessern
Zusammenfassen
Die Strategie baut ein robustes Trend-Tracking-System auf, das EMA-Kreuzungen und RSI-Dynamik bestätigt. Die ausgereiften Risikokontrollmechanismen und die klare visuelle Oberfläche machen sie sehr praktisch. Die Gesamtleistung der Strategie wird durch die empfohlene Optimierungsrichtung weiter verbessert werden.
/*backtest
start: 2024-11-26 00:00:00
end: 2024-12-25 08:00:00
period: 1h
basePeriod: 1h
exchanges: [{"eid":"Futures_Binance","currency":"BTC_USDT"}]
*/

//@version=5
strategy("EMA Crossover with RSI Confirmation and Buy/Sell Signals", overlay=true)

// Input for EMAs and RSI
fastLength = input.int(9, title="Fast EMA Length")
slowLength = input.int(21, title="Slow EMA Length")
rsiLength = input.int(14, title="RSI Length")
rsiLevel = input.int(50, title="RSI Level", minval=0, maxval=100)

// Calculate the EMAs and RSI
fastEMA = ta.ema(close, fastLength)
slowEMA = ta.ema(close, slowLength)
rsi = ta.rsi(close, rsiLength)

// Plot the EMAs on the chart
plot(fastEMA, color=color.green, linewidth=2, title="Fast EMA (9)")
plot(slowEMA, color=color.red, linewidth=2, title="Slow EMA (21)")

// Plot the RSI on a separate pane (below the chart)
hline(rsiLevel, "RSI Level", color=color.gray)
plot(rsi, color=color.blue, linewidth=2, title="RSI")

// Buy condition: Fast EMA crosses above Slow EMA and RSI crosses above 50
buyCondition = ta.crossover(fastEMA, slowEMA) and rsi > rsiLevel

// Sell condition: Fast EMA crosses below Slow EMA and RSI crosses below 50
sellCondition = ta.crossunder(fastEMA, slowEMA) and rsi < rsiLevel

// Execute trades based on conditions
if (buyCondition)
    strategy.entry("Buy", strategy.long)
    label.new(bar_index, low, "Buy", color=color.green, textcolor=color.white, style=label.style_label_up, size=size.small)

if (sellCondition)
    strategy.close("Buy")
    label.new(bar_index, high, "Sell", color=color.red, textcolor=color.white, style=label.style_label_down, size=size.small)

// Strategy exit (optional): Fixed risk-to-reward ratio (take profit and stop loss)
takeProfit = input.int(2, title="Take Profit (Risk-Reward)", minval=1)
stopLoss = input.int(1, title="Stop Loss (Risk-Reward)", minval=1)

strategy.exit("Exit Buy", "Buy", stop=close * (1 - stopLoss / 100), limit=close * (1 + takeProfit / 100))

// Plot buy/sell arrows for visualization
plotarrow(buyCondition ? 1 : na, offset=-1, colorup=color.green, maxheight=30, title="Buy Signal Arrow")
plotarrow(sellCondition ? -1 : na, offset=-1, colordown=color.red, maxheight=30, title="Sell Signal Arrow")